

Metabolic requirements for neutrophil extracellular traps formation
- PMID: 25545227
- PMCID: PMC4427386
- DOI: 10.1111/imm.12437
Metabolic requirements for neutrophil extracellular traps formation
Abstract
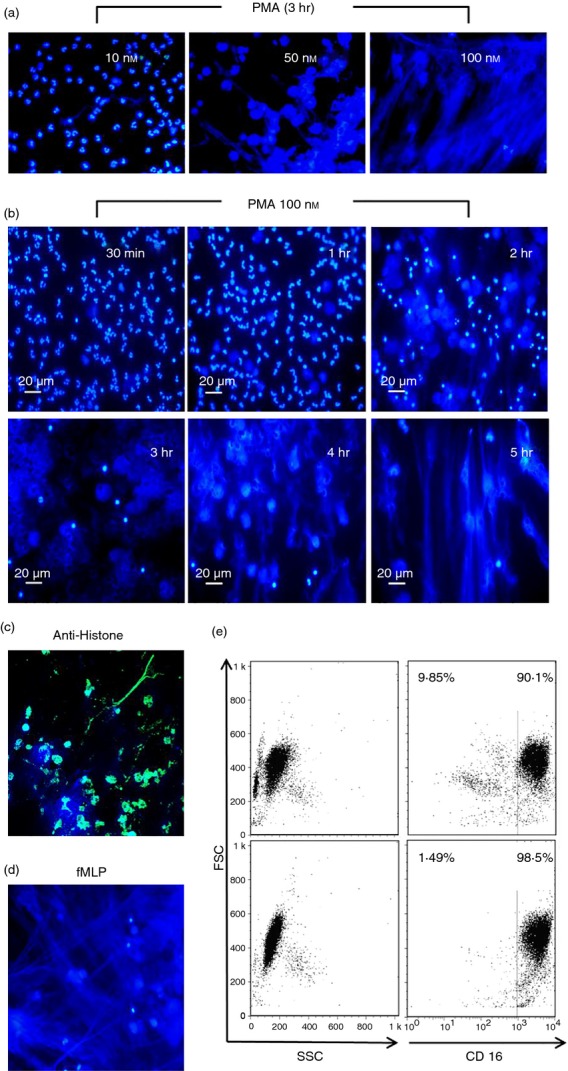
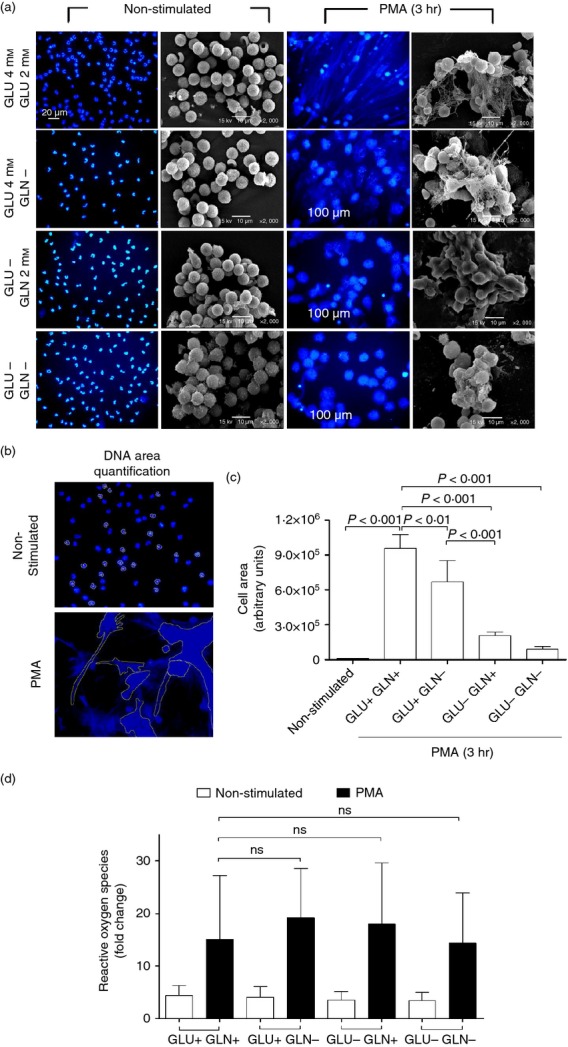
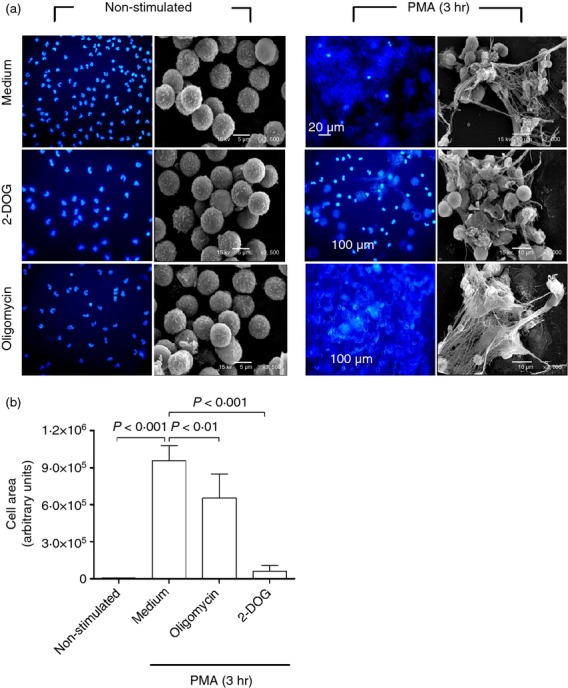
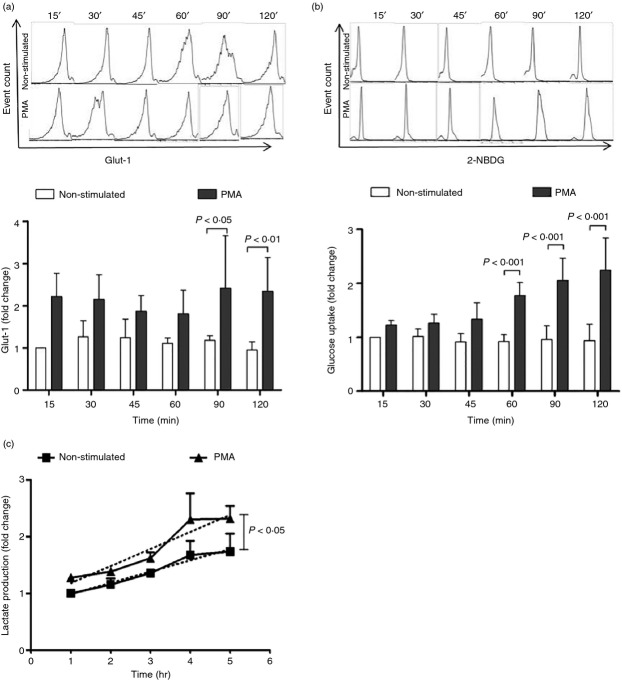
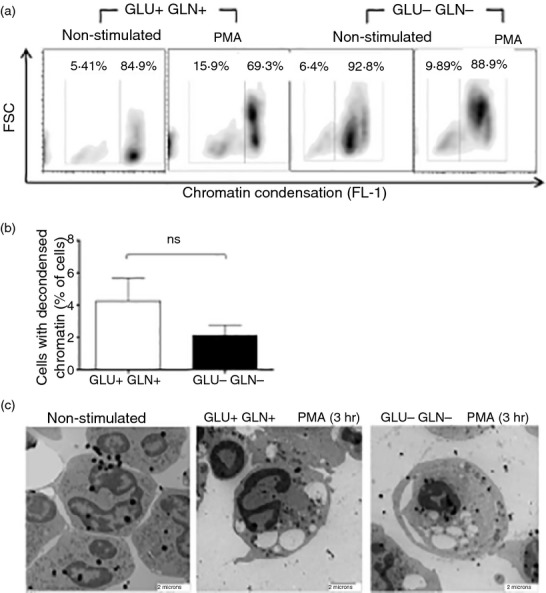
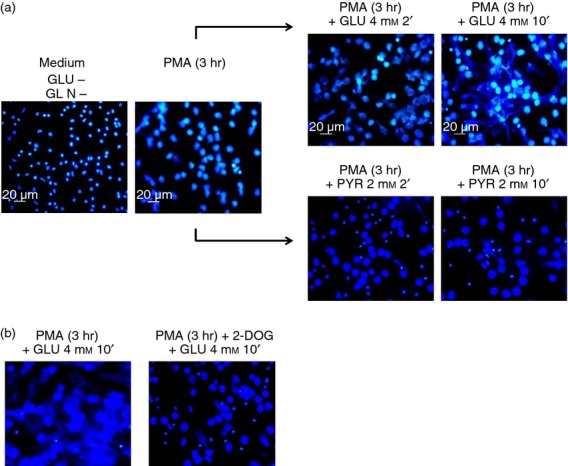
As part of the innate immune response, neutrophils are at the forefront of defence against infection, resolution of inflammation and wound healing. They are the most abundant leucocytes in the peripheral blood, have a short lifespan and an estimated turnover of 10(10) to 10(11) cells per day. Neutrophils efficiently clear microbial infections by phagocytosis and by oxygen-dependent and oxygen-independent mechanisms. In 2004, a new neutrophil anti-microbial mechanism was described, the release of neutrophil extracellular traps (NETs) composed of DNA, histones and anti-microbial peptides. Several microorganisms, bacterial products, as well as pharmacological stimuli such as PMA, were shown to induce NETs. Neutrophils contain relatively few mitochondria, and derive most of their energy from glycolysis. In this scenario we aimed to analyse some of the metabolic requirements for NET formation. Here it is shown that NETs formation is strictly dependent on glucose and to a lesser extent on glutamine, that Glut-1, glucose uptake, and glycolysis rate increase upon PMA stimulation, and that NET formation is inhibited by the glycolysis inhibitor, 2-deoxy-glucose, and to a lesser extent by the ATP synthase inhibitor oligomycin. Moreover, when neutrophils were exposed to PMA in glucose-free medium for 3 hr, they lost their characteristic polymorphic nuclei but did not release NETs. However, if glucose (but not pyruvate) was added at this time, NET release took place within minutes, suggesting that NET formation could be metabolically divided into two phases; the first, independent from exogenous glucose (chromatin decondensation) and, the second (NET release), strictly dependent on exogenous glucose and glycolysis.
Keywords: ATP synthase; cell metabolism; glycolysis; neutrophil extracellular traps; neutrophils.
© 2014 John Wiley & Sons Ltd.
Figures
Similar articles
-
Metabolic Pathways Involved in Formation of Spontaneous and Lipopolysaccharide-Induced Neutrophil Extracellular Traps (NETs) Differ in Obesity and Systemic Inflammation.Int J Mol Sci. 2021 Jul 19;22(14):7718. doi: 10.3390/ijms22147718. Int J Mol Sci. 2021. PMID: 34299338 Free PMC article.
-
Dengue Virus Serotype-2 Interferes with the Formation of Neutrophil Extracellular Traps.Intervirology. 2015;58(4):250-9. doi: 10.1159/000440723. Epub 2015 Oct 24. Intervirology. 2015. PMID: 26496355
-
Effects of the antioxidants Trolox, Tiron and Tempol on neutrophil extracellular trap formation.Immunobiology. 2016 Feb;221(2):208-19. doi: 10.1016/j.imbio.2015.09.005. Epub 2015 Sep 7. Immunobiology. 2016. PMID: 26371849
-
Cytonemes Versus Neutrophil Extracellular Traps in the Fight of Neutrophils with Microbes.Int J Mol Sci. 2020 Jan 16;21(2):586. doi: 10.3390/ijms21020586. Int J Mol Sci. 2020. PMID: 31963289 Free PMC article. Review.
-
Neutrophil Extracellular Traps in Periodontitis: A Web of Intrigue.J Dent Res. 2016 Jan;95(1):26-34. doi: 10.1177/0022034515609097. Epub 2015 Oct 6. J Dent Res. 2016. PMID: 26442948 Review.
Cited by
-
A Metabolic Shift toward Pentose Phosphate Pathway Is Necessary for Amyloid Fibril- and Phorbol 12-Myristate 13-Acetate-induced Neutrophil Extracellular Trap (NET) Formation.J Biol Chem. 2015 Sep 4;290(36):22174-83. doi: 10.1074/jbc.M115.640094. Epub 2015 Jul 21. J Biol Chem. 2015. PMID: 26198639 Free PMC article.
-
Modulation of the Functional State of Mouse Neutrophils by Selenium Nanoparticles In Vivo.Int J Mol Sci. 2022 Nov 7;23(21):13651. doi: 10.3390/ijms232113651. Int J Mol Sci. 2022. PMID: 36362436 Free PMC article.
-
Immunometabolism of Phagocytes and Relationships to Cardiac Repair.Front Cardiovasc Med. 2019 Apr 11;6:42. doi: 10.3389/fcvm.2019.00042. eCollection 2019. Front Cardiovasc Med. 2019. PMID: 31032261 Free PMC article. Review.
-
Metabolic Pathways Involved in Formation of Spontaneous and Lipopolysaccharide-Induced Neutrophil Extracellular Traps (NETs) Differ in Obesity and Systemic Inflammation.Int J Mol Sci. 2021 Jul 19;22(14):7718. doi: 10.3390/ijms22147718. Int J Mol Sci. 2021. PMID: 34299338 Free PMC article.
-
Integrating genetic and immune factors to uncover pathogenetic mechanisms of viral-associated pulmonary aspergillosis.mBio. 2024 Jun 12;15(6):e0198223. doi: 10.1128/mbio.01982-23. Epub 2024 Apr 23. mBio. 2024. PMID: 38651925 Free PMC article. Review.
References
-
- Glasser L, Fiederlein RL. Functional differentiation of normal human neutrophils. Blood. 1987;69:937–44. - PubMed
Publication types
MeSH terms
Substances
LinkOut - more resources
Full Text Sources
Other Literature Sources
Research Materials
Miscellaneous
