Cutting edge: maresin-1 engages regulatory T cells to limit type 2 innate lymphoid cell activation and promote resolution of lung inflammation
- PMID: 25539814
- PMCID: PMC4297713
- DOI: 10.4049/jimmunol.1402534
Cutting edge: maresin-1 engages regulatory T cells to limit type 2 innate lymphoid cell activation and promote resolution of lung inflammation
Abstract
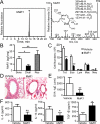
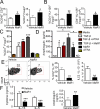
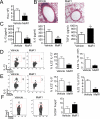
Asthma is a chronic inflammatory disease that fails to resolve. Recently, a key role for type 2 innate lymphoid cells (ILC2s) was linked to asthma pathogenesis; however, mechanisms for ILC2 regulation remain to be determined. In this study, metabololipidomics of murine lungs identified temporal changes in endogenous maresin 1 (MaR1) during self-limited allergic inflammation. Exogenous MaR1 reduced lung inflammation and ILC2 expression of IL-5 and IL-13 and increased amphiregulin. MaR1 augmented de novo generation of regulatory T cells (Tregs), which interacted with ILC2s to markedly suppress cytokine production in a TGF-β-dependent manner. Ab-mediated depletion of Tregs interrupted MaR1 control of ILC2 expression of IL-13 in vivo. Together, the findings uncover Tregs as potent regulators of ILC2 activation; MaR1 targets Tregs and ILC2s to restrain allergic lung inflammation, suggesting MaR1 as the basis for a new proresolving therapeutic approach to asthma and other chronic inflammatory diseases.
Copyright © 2015 by The American Association of Immunologists, Inc.
Figures


Similar articles
-
Regulatory T cells and type 2 innate lymphoid cell-dependent asthma.Allergy. 2017 Aug;72(8):1148-1155. doi: 10.1111/all.13139. Epub 2017 Mar 1. Allergy. 2017. PMID: 28160290 Review.
-
T-bet inhibits innate lymphoid cell-mediated eosinophilic airway inflammation by suppressing IL-9 production.J Allergy Clin Immunol. 2017 Apr;139(4):1355-1367.e6. doi: 10.1016/j.jaci.2016.08.022. Epub 2016 Sep 23. J Allergy Clin Immunol. 2017. PMID: 27670243
-
A Proinflammatory Role of Type 2 Innate Lymphoid Cells in Murine Immune-Mediated Hepatitis.J Immunol. 2017 Jan 1;198(1):128-137. doi: 10.4049/jimmunol.1600418. Epub 2016 Nov 21. J Immunol. 2017. PMID: 27872212
-
Leukotriene C4 Potentiates IL-33-Induced Group 2 Innate Lymphoid Cell Activation and Lung Inflammation.J Immunol. 2017 Aug 1;199(3):1096-1104. doi: 10.4049/jimmunol.1601569. Epub 2017 Jun 30. J Immunol. 2017. PMID: 28667163 Free PMC article.
-
Group 2 Innate Lymphoid Cells in Airway Diseases.Chest. 2019 Jul;156(1):141-149. doi: 10.1016/j.chest.2019.04.101. Epub 2019 May 10. Chest. 2019. PMID: 31082387 Free PMC article. Review.
Cited by
-
n-3 Polyunsaturated Fatty Acids Modulate LPS-Induced ARDS and the Lung-Brain Axis of Communication in Wild-Type versus Fat-1 Mice Genetically Modified for Leukotriene B4 Receptor 1 or Chemerin Receptor 23 Knockout.Int J Mol Sci. 2023 Aug 31;24(17):13524. doi: 10.3390/ijms241713524. Int J Mol Sci. 2023. PMID: 37686333 Free PMC article.
-
Specialized proresolving mediators (SPMs) inhibit human B-cell IgE production.Eur J Immunol. 2016 Jan;46(1):81-91. doi: 10.1002/eji.201545673. Epub 2015 Nov 2. Eur J Immunol. 2016. PMID: 26474728 Free PMC article.
-
Pro-resolving lipid mediators: regulators of inflammation, metabolism and kidney function.Nat Rev Nephrol. 2021 Nov;17(11):725-739. doi: 10.1038/s41581-021-00454-y. Epub 2021 Jul 19. Nat Rev Nephrol. 2021. PMID: 34282342 Free PMC article. Review.
-
The Role of Type 2 Innate Lymphoid Cells in Allergic Diseases.Front Immunol. 2021 Jun 9;12:586078. doi: 10.3389/fimmu.2021.586078. eCollection 2021. Front Immunol. 2021. PMID: 34177881 Free PMC article. Review.
-
Effects of Bioactive Dietary Components on Changes in Lipid and Liver Parameters in Women after Bariatric Surgery and Procedures.Nutrients. 2024 May 1;16(9):1379. doi: 10.3390/nu16091379. Nutrients. 2024. PMID: 38732625 Free PMC article.
References
Publication types
MeSH terms
Substances
Grants and funding
LinkOut - more resources
Full Text Sources
Other Literature Sources
Medical

