. 2015 Jan 22;57(2):273-89.
doi: 10.1016/j.molcel.2014.11.016. Epub 2014 Dec 18.

Yeast PP4 interacts with ATR homolog Ddc2-Mec1 and regulates checkpoint signaling

Affiliations

Yeast PP4 interacts with ATR homolog Ddc2-Mec1 and regulates checkpoint signaling

Nicole Hustedt et al. Mol Cell. .

Abstract

Mec1-Ddc2 (ATR-ATRIP) controls the DNA damage checkpoint and shows differential cell-cycle regulation in yeast. To find regulators of Mec1-Ddc2, we exploited a mec1 mutant that retains catalytic activity in G2 and recruitment to stalled replication forks, but which is compromised for the intra-S phase checkpoint. Two screens, one for spontaneous survivors and an E-MAP screen for synthetic growth effects, identified loss of PP4 phosphatase, pph3Δ and psy2Δ, as the strongest suppressors of mec1-100 lethality on HU. Restored Rad53 phosphorylation accounts for part, but not all, of the pph3Δ-mediated survival. Phosphoproteomic analysis confirmed that 94% of the mec1-100-compromised targets on HU are PP4 regulated, including a phosphoacceptor site within Mec1 itself, mutation of which confers damage sensitivity. Physical interaction between Pph3 and Mec1, mediated by cofactors Psy2 and Ddc2, is shown biochemically and through FRET in subnuclear repair foci. This establishes a physical and functional Mec1-PP4 unit for regulating the checkpoint response.


Figures

Figure 1
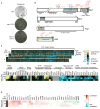
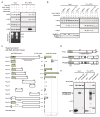
Figure 1. Mutations in PSY2 and PPH3 Genes Suppress mec1-100 HU Sensitivity
(A) The indicated strains (see Tables S1 and S2) were plated on YPAD + 50 mM HU for 3 days at 30°C. Colonies appear white on dark background. (B) Mec1, Ddc2, Psy2, and Pph3 domain architecture with mec1-100 mutations in black and mec1-100 suppressor mutations in red. Bold, mutations found more than once independently. Asterisks, STOP codon at indicated residue or frameshift (aa 181) resulting in STOP at aa 183 (GA-6610). (C) Upper panel, overview of genetic interaction screen (E-MAP; full data in Table S4), 35 mutant “query” strains combined with 1,525 mutant strains (1,311 after quality control), see Table S3. Double mutant growth was scored on 0, 20, and 100 mM HU. Genetic interaction scoring is at right. Hatching indicates “no data” in E-MAP, but confirmed negative interaction by drop assay (see Figure S1E). Lower panel, selected mec1-100 genetic interactions, including phosphatase mutants (significant positive interaction with mec1-100 are in bold). DAmP allele = D. Complete mec1-100 genetic interactions are in Figure S1. (D) Heat map of Pearson correlation coefficients for mec1-100 genetic interaction profile with those of the other strains on 0, 20, and 100 mM HU. Correlation coding is at right.
Figure 2
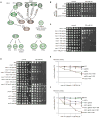
Figure 2. Validation of psy2Δ and pph3Δ as Suppressors of mec1-100 HU Sensitivity
(A) Scheme of yeast phosphatases and relationships with mec1-100 or checkpoint downregulation roles, see text. (B) pph3Δ or pph3Δ mec1-100 cells with TRP1-based control plasmid or plasmids expressing PPH3 or pph3-H112N from PPH3 promoter. Cells grown in synthetic complete medium (lacking tryptophan) (SC-TRP) in a 5-fold dilution series on SC-TRP ±100 mM HU. (C) A 5-fold dilution series on YPAD ±100 mM HU of isogenic strains with indicated genotypes (see Tables S1 and S2). (D) Isogenic strains with indicated genotypes were treated as in (C). (E) Recovery from replication fork stalling was monitored as colony outgrowth of cells after synchronization in G1 by α factor and release into S phase with 0.2 M HU for indicated times. Genotypes of isogenic strains are indicated in Tables S1 and S2. Error bars indicate SD. (F) Isogenic strains with indicated genotypes were treated as in (E).
Figure 3
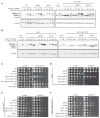
Figure 3. Suppression of mec1-100 Correlates with Rad53 Activation
(A) Rad53 phosphorylation monitored by western blot after synchronization in G1 (α factor) and release for the indicated times into 0.2 M HU. Genotypes of isogenic strains are indicated in Tables S1 and S2. (B) Isogenic strains as indicated (see Tables S1 and S2) were treated as in (A). (C) A 5-fold dilution series on YPAD ±100 mM HU. Genotypes of isogenic strains are indicated in Tables S1 and S2. (D) A 5-fold dilution series of isogenic strains as indicated on YPAD ±2 mM HU. Asterisk, 10× more cells plated. (E) Isogenic strains with indicated genotypes were treated as in (D). (F) Isogenic strains with indicated genotypes were treated as in (D). See Figure S2; Tables S1 and S2.
Figure 4
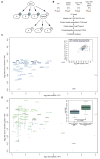
Figure 4. Most mec1-100-Regulated Phosphopeptides Are Upregulated by Pph3 Loss
(A) Scheme of Mec1-dependent and Rad53-independent phosphorylation sites. (B) Phosphoproteomics experimental scheme, in which three cultures of each indicated strain (see Tables S1 and S2) were synchronized in G1 and released 45 min in 0.2 M HU. Phosphoproteomics sample preparation is in Supplemental Experimental Procedures. (C) Phosphopeptide abundances (log2 ratio [mutant/WT]) in mec1-100 tel1Δ cells plotted against abundances in rad53Δ sml1Δ. Shown are mec1-100/Tel1 specific phosphopetides which have a log2 ratio ≤−1 for mec1-100 tel1Δ / WT (p ≤ 0.05, Student’s paired t test over three replicates) and log2 ratio ≥−1 for rad53Δ sml1Δ / WT. Full list in Table S6. Phosphopeptides modified on p[S/T]Q consenses are in dark blue and bold, labeled by protein names. Inlay, plotting of indicated ratios of all quantified phosphopeptides (Table S5). Blue, mec1-100/Tel1 specific phosphopeptides. (D) Plotting of phosphopeptide abundances (log2 ratio [mutant/WT]) in mec1-100 tel1Δ pph3Δ cells against phosphopeptide abundances in rad53Δ sml1Δ cells of phosphopeptides used in (C). Blue circles indicate position in previous plot (C), and gray lines connect same phosphopeptides. Inlay, Tukey boxplot of ratios of mec1-100/tel1-specific phosphopeptides and p values calculated by one-tailed Wilcoxon signed rank test. See Figure S3.
Figure 5
Figure 5. Ddc2 and Psy2 Interact Physically
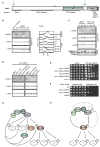
(A) Native extracts from cycling cultures of indicated strains (see Tables S1 and S2) ± RNaseA and benzonase treatment were subjected to anti-GFP IP and western blotting with indicated antibodies. Nucleic acid digestion in GFP-depleted extracts after IP was analyzed by agarose gel and SYBR Safe. (B) Cells of indicated genotypes (see Tables S1 and S2) were arrested in G1 by α factor and held or released into 0.2M HU for 30 min. Extracts were subjected to anti-GFP IP and western blotting with indicated antibodies. (C) Y2H analysis of DDC2 fused to B42-AD and PSY2 fragments fused to lexA-DBD. Bars indicate β-galactosidase activity (error bars represent SD); symbols indicate color on X-GAL plate (raw data in Figure S5C). Dubious interaction (±) and not determined (n.d.). (D) Scheme of Clustal Omega multiple sequence alignment of Psy2 (P40164), PP4R3A (Q6IN85-1), and PP4R3B (Q5MIZ7-1). Vertical lines, alignment gaps ≥5 aa; gray, region missing in clone Q5MIZ7-3, used in (E). The % sequence similarity (in brackets % identity) calculation based on PSY2 length or length of indicated fragments. (E) HEK293T cells were transfected with plasmids expressing MYC-ATRIP (#3,525) and GFP (#3,493), PP4R3A-GFP (#3,518), or PP4R3B-GFP (#3,588). Native extracts at 48 hr post transfection were subjected to anti-GFP IP and western blotting as indicated. See Figures S4 and S5.
Figure 6
Figure 6. Ddc2-GFP and Psy2-RFP Foci Colocalize and Show FRET Signals
(A–D) RFA1-CFP DDC2-GFP PSY2-RFP cells were incubated ±0.2 M HU for 1 hr prior to fixation for microscopy. (A) Images of untreated G1 and S phase cells showing indicated fluorescence channels. Bar, 2 μm. Dashed line encircles cell nucleus. (B) Examples of HU-treated cells showing colocalization of all three proteins in two foci (upper panel), or of colocalization of Ddc2 and Psy2 only (lower panel). Arrowheads = foci. (C) Quantification of bright focus number per S phase cell. (D) Colocalization of Rfa1 and Ddc2 spots with indicated protein after HU treatment. (E) Schematic of FRET principle, GFP and RFP must be within 10 nm for RFP emission. (F) DDC2-GFP PSY2-RFP, DDC2-GFP RFA1-RFP, and PSY2-GFP RFA1-RFP cells treated 1 hr ± 0.2 M H U or 400 μg/ml Zeocin prior to fixation, were analyzed for FRET-induced RFP signals at bright GFP foci (“focus”) or in the nucleus without a focus (“diffuse”). Because Rfa1-RFP cells showed slight sensitivity to MMS (Figure S4F), low FRET signals were confirmed with Rfa2-GFP/Psy2-RFP (data not shown). See Figure S6.
Figure 7
Figure 7. Mec1 Phosphoserine 1991 Is Regulated by Rad53 and Pph3
(A) Mec1 phosphosites in blue, black lines = mec1-100 mutations, and red lines = suppressor mutations (Figure 1), and interaction domains and structural domains indicated below. (B) Ddc2-GFP and Ddc2-GFP mec1-S1991A cells were treated with 0.2MHU for 1 hr or arrested in G1 and released into YPAD at 25°C for indicated times. FACS was performed on samples to confirm cell cycle stages. After IP with α-GFP, western blots were performed with indicated antibodies, e.g., α-pMec1 (Mec1 phosphoserine 1991). (C) Exponential cultures of Ddc2-GFP and Ddc2-GFP mec1-100 ±0.2 M HU or 400 μg/ml Zeocin for 1 hr were extracted and subjected to IP by α-GFP. Western blots were probed with indicated antibodies, and input samples were probed with α-Rad53 to monitor checkpoint activation. (D) Native extracts were prepared from Ddc2-GFP strains with indicated genotypes (see Tables S1 and S2) after 1 hr incubation + 0.2MHU. α-GFP IP and western blotting with indicated antibodies was performed. (E) 10-fold dilution series on YPAD ±100 μg/ml Zeocin of isogenic strains of indicated genotypes (see Tables S1 and S2). (F) Cells transformed with pGAL-EcoRI (#2,745) and grown in selective medium to ensure plasmid retention were plated on 2% glucose or galactose supplemented with 2% raffinose, in 10-fold dilution series. (G) Model of Ddc2-Psy2 interaction and coordinated interplay of Mec1-Ddc2 and Pph3-Psy2. Both target Rad53, H2A, and other targets. Most mec1-100/Tel1-specific phosphosites are regulated by Pph3-Psy2 (“B”), while a few are not (“A”). (H) Mec1 phosphoserine 1991 requires Rad53 and Mec1, is compromised in mec1-100 cells, and rescued by loss of Pph3-Psy2. Mec1 regulation of Mec1 may be indirect. See Figure S7.

Similar articles

Cited by

References

    1. Aguilera A, García-Muse T. Causes of genome instability. Annu Rev Genet. 2013;47:1–32. - PubMed
    1. Alcasabas AA, Osborn AJ, Bachant J, Hu F, Werler PJ, Bousset K, Furuya K, Diffley JF, Carr AM, Elledge SJ. Mrc1 transduces signals of DNA replication stress to activate Rad53. Nat Cell Biol. 2001;3:958–965. - PubMed
    1. Bandyopadhyay S, Mehta M, Kuo D, Sung MK, Chuang R, Jaehnig EJ, Bodenmiller B, Licon K, Copeland W, Shales M, et al. Rewiring of genetic networks in response to DNA damage. Science. 2010;330:1385–1389. - PMC - PubMed
    1. Bazzi M, Mantiero D, Trovesi C, Lucchini G, Longhese MP. Dephosphorylation of gamma H2A by Glc7/protein phosphatase 1 promotes recovery from inhibition of DNA replication. Mol Cell Biol. 2010;30:131–145. - PMC - PubMed
    1. Brush GS, Morrow DM, Hieter P, Kelly TJ. The ATM homologue MEC1 is required for phosphorylation of replication protein A in yeast. Proc Natl Acad Sci USA. 1996;93:15075–15080. - PMC - PubMed

Publication types

MeSH terms

Substances