Bifurcation analysis of single-cell gene expression data reveals epigenetic landscape
- PMID: 25512504
- PMCID: PMC4284553
- DOI: 10.1073/pnas.1408993111
Bifurcation analysis of single-cell gene expression data reveals epigenetic landscape
Abstract
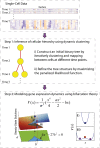
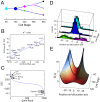
We present single-cell clustering using bifurcation analysis (SCUBA), a novel computational method for extracting lineage relationships from single-cell gene expression data and modeling the dynamic changes associated with cell differentiation. SCUBA draws techniques from nonlinear dynamics and stochastic differential equation theories, providing a systematic framework for modeling complex processes involving multilineage specifications. By applying SCUBA to analyze two complementary, publicly available datasets we successfully reconstructed the cellular hierarchy during early development of mouse embryos, modeled the dynamic changes in gene expression patterns, and predicted the effects of perturbing key transcriptional regulators on inducing lineage biases. The results were robust with respect to experimental platform differences between RT-PCR and RNA sequencing. We selectively tested our predictions in Nanog mutants and found good agreement between SCUBA predictions and the experimental data. We further extended the utility of SCUBA by developing a method to reconstruct missing temporal-order information from a typical single-cell dataset. Analysis of a hematopoietic dataset suggests that our method is effective for reconstructing gene expression dynamics during human B-cell development. In summary, SCUBA provides a useful single-cell data analysis tool that is well-suited for the investigation of developmental processes.
Keywords: bifurcation; differentiation; gene expression; single cell.
Conflict of interest statement
The authors declare no conflict of interest.
Figures


Similar articles
-
Stem cell differentiation as a many-body problem.Proc Natl Acad Sci U S A. 2014 Jul 15;111(28):10185-90. doi: 10.1073/pnas.1408561111. Epub 2014 Jun 19. Proc Natl Acad Sci U S A. 2014. PMID: 24946805 Free PMC article.
-
[OCT4 and NANOG are the key genes in the system of pluripotency maintenance in mammalian cells].Genetika. 2008 Dec;44(12):1589-608. Genetika. 2008. PMID: 19178078 Review. Russian.
-
Formation of an active tissue-specific chromatin domain initiated by epigenetic marking at the embryonic stem cell stage.Mol Cell Biol. 2005 Mar;25(5):1804-20. doi: 10.1128/MCB.25.5.1804-1820.2005. Mol Cell Biol. 2005. PMID: 15713636 Free PMC article.
-
Rest promotes the early differentiation of mouse ESCs but is not required for their maintenance.Cell Stem Cell. 2010 Jan 8;6(1):10-5. doi: 10.1016/j.stem.2009.12.003. Cell Stem Cell. 2010. PMID: 20085738 No abstract available.
-
Heterogeneity of embryonic and adult stem cells.Cell Stem Cell. 2008 Nov 6;3(5):480-3. doi: 10.1016/j.stem.2008.10.007. Cell Stem Cell. 2008. PMID: 18983963 Review.
Cited by
-
Application of single-cell genomics in cancer: promise and challenges.Hum Mol Genet. 2015 Oct 15;24(R1):R74-84. doi: 10.1093/hmg/ddv235. Epub 2015 Jun 25. Hum Mol Genet. 2015. PMID: 26113645 Free PMC article. Review.
-
Increased robustness of early embryogenesis through collective decision-making by key transcription factors.BMC Syst Biol. 2015 Jun 2;9:23. doi: 10.1186/s12918-015-0169-8. BMC Syst Biol. 2015. PMID: 26033487 Free PMC article.
-
Mpath maps multi-branching single-cell trajectories revealing progenitor cell progression during development.Nat Commun. 2016 Jun 30;7:11988. doi: 10.1038/ncomms11988. Nat Commun. 2016. PMID: 27356503 Free PMC article.
-
Bifurcation instructed design of multistate machines.Proc Natl Acad Sci U S A. 2023 Aug 22;120(34):e2300081120. doi: 10.1073/pnas.2300081120. Epub 2023 Aug 14. Proc Natl Acad Sci U S A. 2023. PMID: 37579174 Free PMC article.
-
Fundamental limits on dynamic inference from single-cell snapshots.Proc Natl Acad Sci U S A. 2018 Mar 6;115(10):E2467-E2476. doi: 10.1073/pnas.1714723115. Epub 2018 Feb 20. Proc Natl Acad Sci U S A. 2018. PMID: 29463712 Free PMC article.
References
-
- Enver T, Pera M, Peterson C, Andrews PW. Stem cell states, fates, and the rules of attraction. Cell Stem Cell. 2009;4(5):387–397. - PubMed
-
- Pevny L, et al. Erythroid differentiation in chimaeric mice blocked by a targeted mutation in the gene for transcription factor GATA-1. Nature. 1991;349(6306):257–260. - PubMed
-
- Tondravi MM, et al. Osteopetrosis in mice lacking haematopoietic transcription factor PU.1. Nature. 1997;386(6620):81–84. - PubMed
-
- Rudnicki MA, et al. MyoD or Myf-5 is required for the formation of skeletal muscle. Cell. 1993;75(7):1351–1359. - PubMed
-
- Takahashi K, Yamanaka S. Induction of pluripotent stem cells from mouse embryonic and adult fibroblast cultures by defined factors. Cell. 2006;126(4):663–676. - PubMed
Publication types
MeSH terms
Substances
Grants and funding
LinkOut - more resources
Full Text Sources
Other Literature Sources
Research Materials

