. 2014 Dec 11;10(12):e1004531.
doi: 10.1371/journal.ppat.1004531. eCollection 2014 Dec.

The role of the NADPH oxidase NOX2 in prion pathogenesis

Affiliations

The role of the NADPH oxidase NOX2 in prion pathogenesis

Silvia Sorce et al. PLoS Pathog. .

Abstract

Prion infections cause neurodegeneration, which often goes along with oxidative stress. However, the cellular source of reactive oxygen species (ROS) and their pathogenetic significance are unclear. Here we analyzed the contribution of NOX2, a prominent NADPH oxidase, to prion diseases. We found that NOX2 is markedly upregulated in microglia within affected brain regions of patients with Creutzfeldt-Jakob disease (CJD). Similarly, NOX2 expression was upregulated in prion-inoculated mouse brains and in murine cerebellar organotypic cultured slices (COCS). We then removed microglia from COCS using a ganciclovir-dependent lineage ablation strategy. NOX2 became undetectable in ganciclovir-treated COCS, confirming its microglial origin. Upon challenge with prions, NOX2-deficient mice showed delayed onset of motor deficits and a modest, but significant prolongation of survival. Dihydroethidium assays demonstrated a conspicuous ROS burst at the terminal stage of disease in wild-type mice, but not in NOX2-ablated mice. Interestingly, the improved motor performance in NOX2 deficient mice was already measurable at earlier stages of the disease, between 13 and 16 weeks post-inoculation. We conclude that NOX2 is a major source of ROS in prion diseases and can affect prion pathogenesis.


Conflict of interest statement

AA was supported by the Novartis Research Foundation. This does not alter our adherence to all PLOS Pathogens policies on sharing data and materials.

Figures
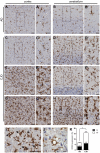
Figure 1
Figure 1. NOX2 expression is increased in affected brain regions of CJD patients.
The expression of NOX2 was analyzed by immunohistochemistry in paraffin-embedded sections of cortical (A,C,E,G) and cerebellar (B,D,F,H) areas of AD (A–B) and CJD (C–H) patients. Representative images of CJD brains with predominant cerebellar (C–D) or cortical (E–F) NOX2 expression are shown together with images of CJD brains with increased NOX2 staining in both areas (G–H). Areas highlighted with dashed boxes in pictures A to H are reproduced at higher magnification in images A′ to H′. Intense NOX2 staining was present around the rim of spongiform vacuoles (I–J; indicated by black arrows in I). Scale bar: 50 µm (A–H); 25 µm (A′–H′); 50 µm (I); 10 µm (J). (K) Bar graphs representing mean ± SEM NOX2 protein expression, quantified as the percentage of the surface occupied by the NOX2 staining over the total measured area in selected regions of frontal cortex (cx) and cerebellar cortex (cb) of AD and CJD patients (AD, n = 3; CJD, n = 10; *P = 0.0398; Student's t test).
Figure 2
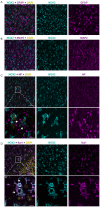
Figure 2. NOX2 expression is localized in microglia cells within CJD brains.
Confocal images of immunofluorescence stainings on CJD patient brain sections: NOX2 is displayed in cyan; GFAP, MAP2, NF and IBA1 in magenta; DAPI in yellow. Panels A, B, C, D, from left to the right: overlay, NOX2 and GFAP, MAP2, NF, or IBA1, respectively; scale bar: 50 µm. Panels C′ and D′: higher magnification of areas in C and D (indicated by box); from left to the right: overlay, NOX2 and NF or IBA1, respectively; arrows indicate spongiform vacuoles; scale bar: 10 µm.
Figure 3
Figure 3. Analysis of NOX2 expression and cellular localization in mice.
(A) Western blot of brain homogenates from Nox2+/Y and Nox2-/Y mice injected i.c. with prions (22 L) or non-infectious brain homogenate (NBH) using antibodies to NOX2 and Actin. Densitometric quantitation of NOX2 signal in Nox2+/Y samples was normalized over Actin signal. Scatter dot plot shows NOX2 relative signal intensity as percentage of NBH samples; each dot corresponds to a mouse (NBH, n = 9; 22 L, n = 10; **, P = 0.0044; Student's t test). (B) Quantitative RT-PCR analysis of Nox2 expression in cerebellar slice cultures from tga20/TK pups treated with NBH or prions (RML), with or without addition of ganciclovir (GCV). Significantly reduced Nox2 expression levels are detected upon microglia depletion with ganciclovir; each dot corresponds to a pool of 6–9 cerebellar slices cultured in the same well (n = 4 pools; *, P<0.05; ****, P<0.0001; one-way ANOVA followed by Bonferroni's post-hoc test). (C) Western blot of cerebellar slice homogenates from tga20/TK pups treated with NBH or prions (RML), with or without addition of GCV using NOX2, IBA1 or Actin antibodies. Densitometric quantitation of NOX2 signal was normalized over Actin signal. Scatter dot plot represents NOX2 relative signal intensity as percentage of NBH samples; each dot corresponds to a pool of 6-9 cerebellar slices cultured in the same well (NBH, n = 3 pools; RML, n = 6 pools; NBH+GCV, n = 6 pools; RML+GCV, n = 6 pools; **, P<0.001; one-way ANOVA followed by Bonferroni's post-hoc test).
Figure 4
Figure 4. Effect of NOX2 expression on microglial proliferation, ROS production and spongiform changes after prion inoculation.
(A) Microglial proliferation was analyzed by immunohistochemistry with the IBA1 antibody on brains of Nox2+/Y (A I-VI) and Nox2-/Y (A VII-XII) mice injected i.c. with NBH or prions and culled at 4, 8, 12, and 16 weeks post inoculation (wpi) or at the terminal stage of disease. Cerebellar areas are displayed in the pictures. Scale bar for A I-XII: 250 µm (displayed in panel XII). Dashed boxes in images VI and XII are shown at higher magnification in panels VI′-VI″ and XII′-XII″; scale bar: 100 µm (displayed in panel XII″). (B) Microglia cell number quantification in cerebellar cortex of Nox2+/Y and Nox2-/Y mice injected i.c. with NBH or 22 L prions and culled at different time points during disease incubation or at terminal stage. Each dot corresponds to one mouse (average of 3–5 sections per mouse). Nox2+/Y, n = 4–7; Nox2-/Y, n = 3–6; no significant difference between Nox2+/Y and Nox2-/Y mice; two-way ANOVA followed by Bonferroni's post-hoc test. (C) Detection of ROS production in vivo was performed by injecting i.p. the DHE probe and analyzing the fluorescence of its oxidation products in cerebellar homogenates. Dot plots show relative fluorescent units (RFU) per mg of proteins; each dot corresponds to one mouse (Nox2+/Y, n = 5–8; Nox2-/Y, n = 4–8): ***, P<0.001; two-way ANOVA followed by Bonferroni's post-hoc test. (D) Representative images of hematoxylin and eosin-stained sections from Nox2+/Y and Nox2-/Y mice injected i.c. with NBH or 22 L prions. Scale bar for D I-VI: 250 µm (displayed in panel VI). Dashed boxes in images I to VI are shown at higher magnification in panels I′-VI′; scale bar: 100 µm (displayed in panel VI′). (E) Number of spongiform vacuoles was quantified in cerebellar cortex of Nox2+/Y and Nox2-/Y mice injected i.c. with NBH or 22 L prions and culled at different time points during disease incubation or at terminal stage. Each dot corresponds to one mouse (average of 7–12 sections per mouse). Nox2+/Y, n = 4–7; Nox2-/Y, n = 3–6; ***P<0.0001; two-way ANOVA followed by Bonferroni's post-hoc test.
Figure 5
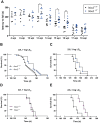
Figure 5. NOX2 deficiency attenuates the progression of prion disease.
(A) Motor capacities of Nox2+/Y and Nox2-/Y mice were assessed with the rotarod test at specified time points after i.c. inoculation with 7 log LD50 units of 22 L prions. Scatter dot plot shows the time spent by each mouse on the rotating rod (latency to fall) expressed in seconds (s). Each dot corresponds to a mouse; a significant overall genotype effect (P = 0.025) was detected using a general linear mixed model. Student's t test per each time point also revealed a significant difference at 13 wpi (*, p = 0.0483); 15 wpi (*, p = 0.0246); and 16 wpi (**, p = 0.0048); Nox2+/Y, n = 4–7; Nox2-/Y, n = 5–11. (B–C) Survival curves of Nox2+/Y and Nox2-/Y males, inoculated i.c with 7 log LD50 (Nox2+/Y, n = 22, median incubation time 150.5 days post inoculation (dpi), Nox2-/Y, n = 22, 157 dpi; P = 0.0052; log-rank test) or 3 log LD50 (Nox2+/Y, n = 9, median incubation time 180 dpi, Nox2-/Y, n = 5, 188 dpi; P = 0.2176; log-rank test) units of 22 L prions. (D–E) Survival curves of females Nox2+/+ and Nox2-/- inoculated i.c. with 7 log LD50 (Nox2+/+, n = 5, 145 dpi, Nox2-/-, n = 7, 145 dpi; P = 0.7289; log-rank test) or 3 log LD50 (Nox2+/+, n = 7, 164 dpi, Nox2-/-, n = 6, 179.5 dpi; P = 0.0030; log-rank test) units of 22 L prions.

Similar articles

Cited by

References

    1. Aguzzi A, Nuvolone M, Zhu C (2013) The immunobiology of prion diseases. Nat Rev Immunol 13: 888–902. - PubMed
    1. Brandner S, Isenmann S, Raeber A, Fischer M, Sailer A, et al. (1996) Normal host prion protein necessary for scrapie-induced neurotoxicity. Nature 379: 339–343. - PubMed
    1. Mallucci G, Dickinson A, Linehan J, Klohn PC, Brandner S, et al. (2003) Depleting neuronal PrP in prion infection prevents disease and reverses spongiosis. Science 302: 871–874. - PubMed
    1. Bueler H, Aguzzi A, Sailer A, Greiner RA, Autenried P, et al. (1993) Mice devoid of PrP are resistant to scrapie. Cell 73: 1339–1347. - PubMed
    1. Moreno JA, Halliday M, Molloy C, Radford H, Verity N, et al. (2013) Oral treatment targeting the unfolded protein response prevents neurodegeneration and clinical disease in prion-infected mice. Sci Transl Med 5: 206ra138. - PubMed

Publication types

MeSH terms

Grants and funding

SS was supported by the Betty and David Koetser Award for Brain Research and a Roche post-doc fellowship; MN was supported by a fellowship from Collegio Ghislieri, Pavia and the Foundation for Research at the Medical Faculty of the University of Zurich, AA was supported by the European Union (PRIORITY; NEURINOX), the SNF (grant 31003A_141193), the Clinical Research Focus Program of the University of Zurich, the Foundation Alliance BioSecure, the Novartis Research Foundation, and an Advanced Grant of the European Research Council (grant 250356). The funders had no role in study design, data collection and analysis, decision to publish, or preparation of the manuscript.