. 2014 Dec 11:5:5744.
doi: 10.1038/ncomms6744.

Spartan deficiency causes genomic instability and progeroid phenotypes

Affiliations

Spartan deficiency causes genomic instability and progeroid phenotypes

Reeja S Maskey et al. Nat Commun. .

Abstract

Spartan (also known as DVC1 and C1orf124) is a PCNA-interacting protein implicated in translesion synthesis, a DNA damage tolerance process that allows the DNA replication machinery to replicate past nucleotide lesions. However, the physiological relevance of Spartan has not been established. Here we report that Spartan insufficiency in mice causes chromosomal instability, cellular senescence and early onset of age-related phenotypes. Whereas complete loss of Spartan causes early embryonic lethality, hypomorphic mice with low amounts of Spartan are viable. These mice are growth retarded and develop cataracts, lordokyphosis and cachexia at a young age. Cre-mediated depletion of Spartan from conditional knockout mouse embryonic fibroblasts results in impaired lesion bypass, incomplete DNA replication, formation of micronuclei and chromatin bridges and eventually cell death. These data demonstrate that Spartan plays a key role in maintaining structural and numerical chromosome integrity and suggest a link between Spartan insufficiency and progeria.


Figures

Figure 1
Figure 1. Sprtn KO causes embryonic lethality.
(a) Schematic of the mouse Sprtn gene and the targeted alleles. An inverted Neo cassette was inserted in the second intron with flanking FLP recognition target (FRT) sequences. LoxP sites were also inserted at the indicated positions. The floxed and KO alleles were created by crossing heterozygote mice with FLP and Cre-transgenic mice, respectively. Positions of genotyping primers are indicated by arrows. (b) PCR-based genotyping (at weaning) of wild-type and Sprtn heterozygote mice produced by intercrossing Sprtn+/−. (c) PCR-based genotyping of wild-type, heterozygote and KO blastocysts. (d) Blastocysts from Sprtn+/− intercrosses were cultured in vitro and observed by phase-contrast microscopy on 6 consecutive days. Representative images of Sprtn+/+, Sprtn+/− and Sprtn−/− blastocysts are shown. Scale bar, 100 μm.
Figure 2
Figure 2. Sprtn KO causes impaired cell proliferation and cell death.
(a) PCR-based genotyping of Sprtn alleles in the indicated MEF lines after 48 h treatment with MeOH or 2 μM 4-OHT. (b) Proliferation of Sprtn-targeted MEFs. Cells treated with MeOH or 4-OHT for 48 h were seeded and cell numbers were counted at the indicated time points. Values are mean±s.d. of three independent experiments. (c) Analyses of apoptosis in Sprtn-targeted MEFs. Two days after the completion of 48 h treatment with MeOH or 4-OHT, cells were stained with Annexin V and PI and analysed by flow cytometry. Values are mean±s.d. of three independent experiments. NS, not significant; ***P<0.001 (two-tailed unpaired t-test). (d) Cell cycle profiling of Sprtn-targeted MEFs. The indicated MEF lines were treated with MeOH or 4-OHT for 48 h. Two days later, cells were stained with PI and analysed by flow cytometry. (e) Cell cycle profiling of SprtnF/F; Cre-ERT2 MEFs (K3) expressing wild-type human Spartan or the E112A mutant after 48 h treatment with MeOH or 4-OHT.
Figure 3
Figure 3. Sprtn KO causes DNA damage and checkpoint activation.
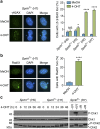
(a) γH2AX focus formation. The indicated MEFs treated with MeOH or 4-OHT for 48 h were stained with anti-γH2AX. At least 300 cells were scored for γH2AX foci and percentages of cells with 5 or more foci are shown. Values are mean±s.d. of three independent experiments. NS, not significant; *P<0.05; ****P<0.0001 (two-tailed unpaired t-test). (b) Rad51 focus formation. The indicated MEFs were stained with anti-Rad51 after 48 h treatment with MeOH or 4-OHT. At least 300 cells were scored for Rad51 foci. Experiments were performed in triplicate and mean±s.d. is shown. ****P<0.0001 (two-tailed unpaired t-test). (c) Western blot analyses of phospho-Chk1 and Chk2. The indicated MEFs were treated with 4-OHT and harvested at various time points. SprtnF/− (H7) cells treated with ultraviolet (40 J m−2) or ionizing radiation (10 Gy) are shown as positive controls for checkpoint kinases activation. Chk1 is used as a loading control. P-Chk1, phospho-Chk1 (Ser345); P-Chk2, phospho-Chk2. Uncropped blots are shown in Supplementary Fig. 7.
Figure 4
Figure 4. Genome instability in Sprtn KO MEFs.
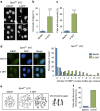
(a) Images showing chromatin bridges (arrows) and micronuclei (arrowheads) in SprtnF/− MEFs treated with MeOH or 4-OHT for 48 h. DNA was visualized by DAPI staining. (b) Quantitation of chromatin bridges. Experiments were performed as in a. At least 300 cells were scored for chromatin bridges and percentages of positive cells are shown. Three independent experiments were performed and mean±s.d. is shown. ****P<0.0001 (two-tailed unpaired t-test). (c) Quantitation of micronuclei-containing cells. Experiments were performed as in a. ****P<0.0001 (two-tailed unpaired t-test). (d) Formation of 53BP1 nuclear bodies. SprtnF/− MEFs were treated with MeOH or 4-OHT for 48 h. At least 300 cells were scored for 53BP1 nuclear bodies and percentages of nuclei with different number of 53BP1 nuclear bodies per nucleus are shown. (e) Chromosomal abnormalities in Sprtn KO cells. SprtnF/− MEFs were treated with MeOH or 4-OHT for 48 h. Twelve hours after completion of the treatments, mitotic spreads were prepared and examined by microscopy. Representative pictures of mitotic spreads are shown in the left panel. Arrows indicate some of the chromosome abnormalities. In the right panel, representative images of chromosome gaps in Sprtn KO MEFs are indicated by arrowheads. (f) Quantitation of abnormal chromosomes. Cells harbouring chromosomal abnormalities were scored in 50 mitotic spreads of SprtnF/− MEFs treated with MeOH or 4-OHT.
Figure 5
Figure 5. Effects of Sprtn KO on DNA replication forks.
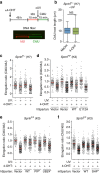
(a) Schematic representation of DNA fiber assays. MEFs were treated with MeOH or 4-OHT for 48 h and sequentially labelled with IdU and CldU to mark ongoing replication. A picture of a representative replication track is shown. At least 100 fibres were scored for each sample in all of the DNA fiber experiments. (b) A box plot showing distribution of the lengths of CldU tracts in SprtnF/− MEFs treated with MeOH or 4-OHT for 48 h. NS, not significant (P=0.829, two-tailed unpaired t-test). (c) Effect of ultraviolet irradiation on replication forks. DNA fiber assays were performed with SprtnF/− MEFs with or without ultraviolet irradiation (40 J m−2) between IdU and CldU labelling. Distribution of replication forks at different CldU/IdU ratios is shown. (df) Effect of ultraviolet irradiation on replication forks. Experiments were performed as in c using SprtnF/F; Cre-ERT2 MEFs (K3) expressing wild-type human Spartan or the E112A mutant (d), wild-type human Spartan, the PIP* or the UBZ* mutant (e), and wild-type mouse Spartan or the SHP* mutant (f). Horizontal red lines in cf indicate median values.
Figure 6
Figure 6. Characterization of Sprtn hypomorphic cells and mice.
(a) PCR-based genotyping of Sprtn+/+, Sprtn+/H and SprtnH/H mice at weaning. (b) Quantitative PCR analyses of Sprtn mRNA levels in Sprtn+/+ and SprtnH/H mice. Sprtn mRNA levels in the kidneys (left) and lungs (right) of two mice per genotype were measured three times by quantitative reverse transcription PCR and mean±s.d. is shown. Values were normalized to Gapdh and shown relative to Sprtn+/+ mouse #27. (c) Growth curves of Sprtn+/+, Sprtn+/H and SprtnH/H mice (n=5, mean±s.d.) of 4–16 weeks. (d,e) Quantitation of cells containing five or more γH2AX foci (d) and micronuclei (e) in the indicated Sprtn+/+ and SprtnH/H primary lung fibroblasts. At least 300 cells were scored in each experiment and percentages of positive cells are shown. Values are mean±s.d. of three independent experiments. For d,e, statistical significance is P<0.001 (H/H group versus +/+ group), two-tailed unpaired t-test. (f) Effect of ultraviolet irradiation on replication forks. DNA fiber assays were performed with Sprtn+/+ and SprtnH/H primary lung fibroblasts with or without ultraviolet irradiation (40 J m−2) between IdU and CldU labelling. Distribution of replication forks at different CldU/IdU ratios is shown. A horizontal red line indicates median value.
Figure 7
Figure 7. Premature ageing phenotypes in SprtnH/H mice.
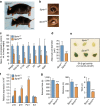
(a) Representative images of 12-month-old Sprtn+/+ and SprtnH/H female mice. Note lordokyphosis in SprtnH/H indicated by the dotted red line. Scale bar, 1 cm. (b) Representative images of the eyes of Sprtn+/+ and SprtnH/H female mice. Note a cataract in SprtnH/H. (c) Body weight, fat mass, body fat percentage and adipose depot weights of 12-month-old Sprtn+/+ and SprtnH/H female mice (n=5, mean±s.d.). Values are normalized to the average of the Sprtn+/+ mice. Because of the smaller body size of the SprtnH/H mice, adipose depot measurements were first calculated relative to body weight. (d) Fat cell diameter measurements (n=5, mean±s.d.). (e) IAT of 12-month-old mice stained for SA-β-gal activity. (f) Relative expression of senescence markers in 12-month-old IAT (n=5, mean±s.d.). Values were normalized to Gapdh and are relative to Sprtn+/+ IAT. (g) Treadmill exercise ability of 12-month-old Sprtn+/+ and SprtnH/H female mice. Exercise time, distance travelled and workload performed are shown (n=5, mean±s.d.). For all panels, statistical significance is as follows: *P<0.05, **P<0.01, ***P<0.001, ****P<0.0001 (two-tailed unpaired t-test).

Similar articles

Cited by

References

    1. Zeman M. K. & Cimprich K. A. Causes and consequences of replication stress. Nat. Cell Biol. 16, 2–9 (2014). - PMC - PubMed
    1. Negrini S., Gorgoulis V. G. & Halazonetis T. D. Genomic instability-an evolving hallmark of cancer. Nat. Rev. Mol. Cell Biol. 11, 220–228 (2010). - PubMed
    1. Vijg J. & Suh Y. Genome instability and aging. Annu. Rev. Physiol. 75, 645–668 (2013). - PubMed
    1. Flach J. et al.. Replication stress is a potent driver of functional decline in ageing haematopoietic stem cells. Nature 512, 198–202 (2014). - PMC - PubMed
    1. Murga M. et al.. A mouse model of ATR-Seckel shows embryonic replicative stress and accelerated aging. Nat. Genet. 41, 891–898 (2009). - PMC - PubMed

Publication types

MeSH terms