. 2015 Jan 13;4(1):155-169.
doi: 10.1016/j.stemcr.2014.11.002. Epub 2014 Dec 11.

A flexible reporter system for direct observation and isolation of cancer stem cells

Affiliations

A flexible reporter system for direct observation and isolation of cancer stem cells

Binwu Tang et al. Stem Cell Reports. .

Abstract

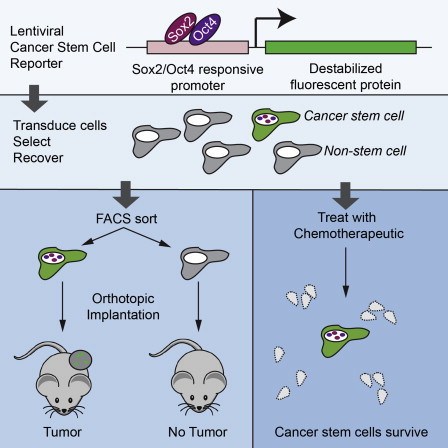
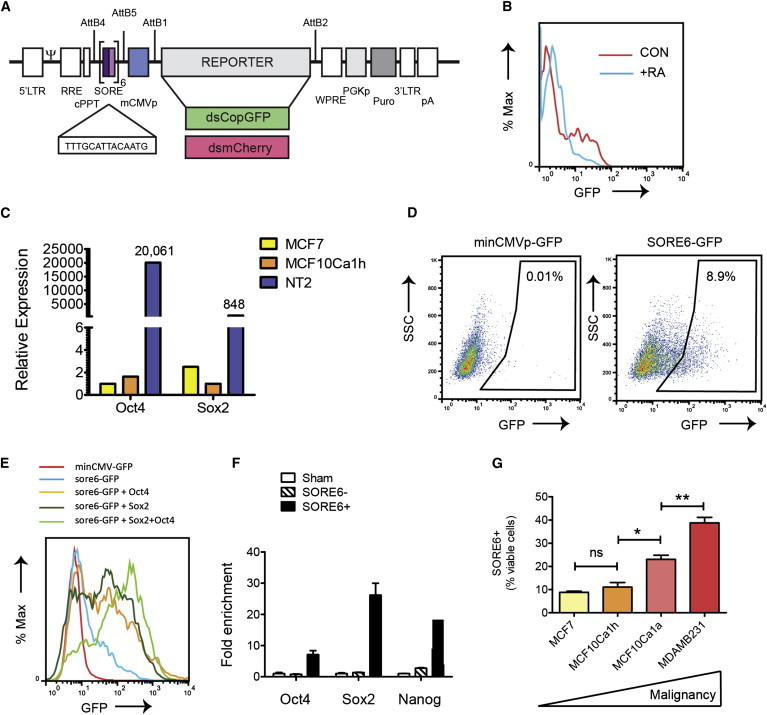
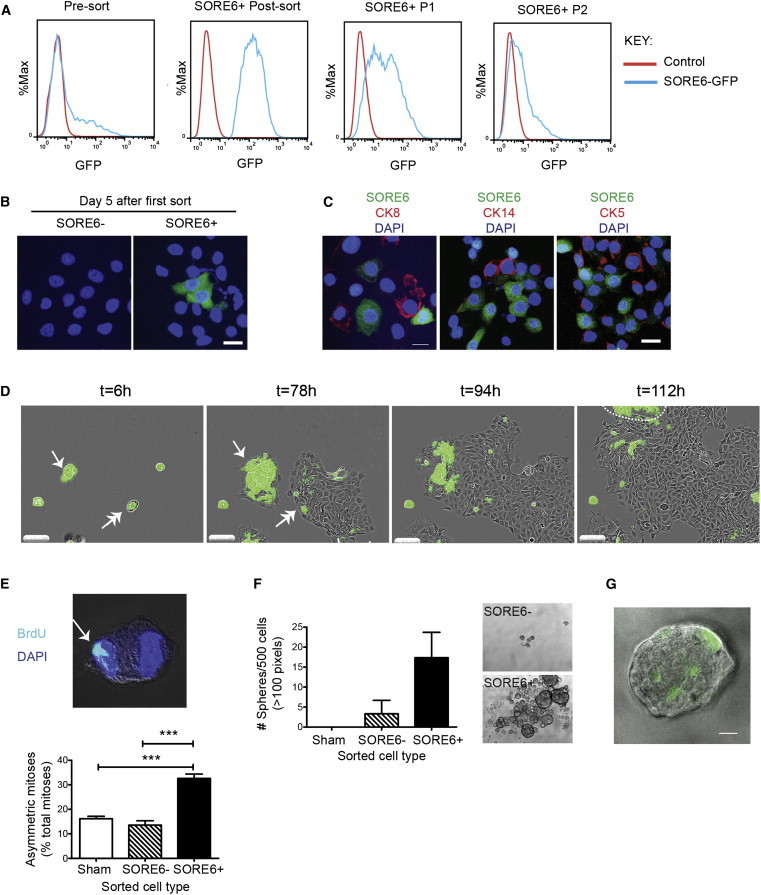
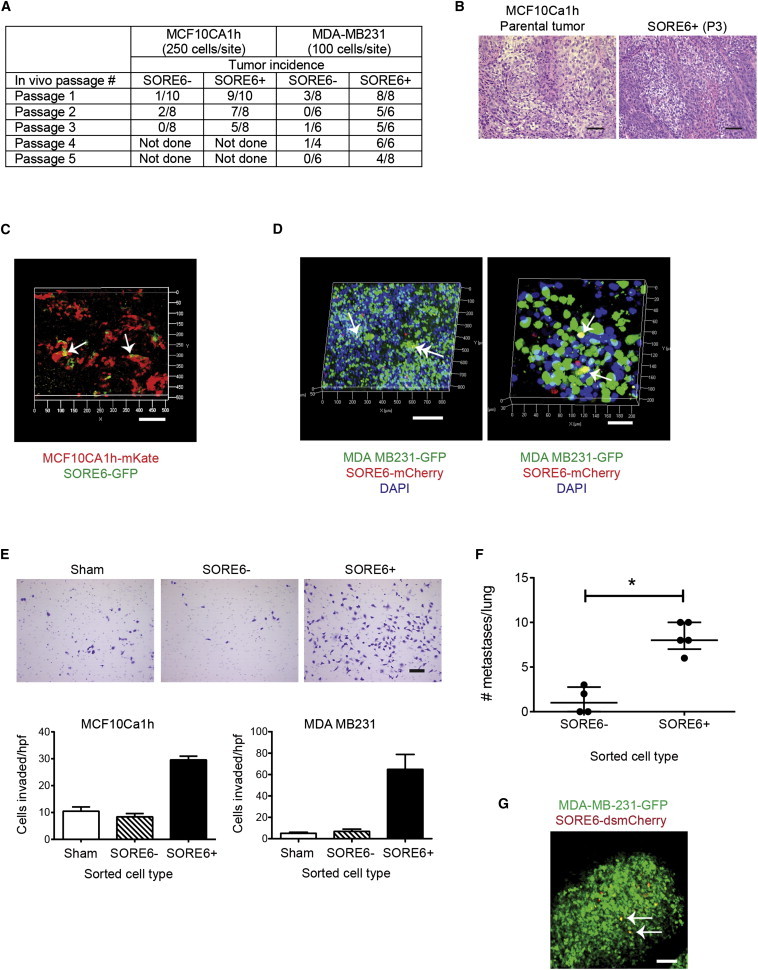
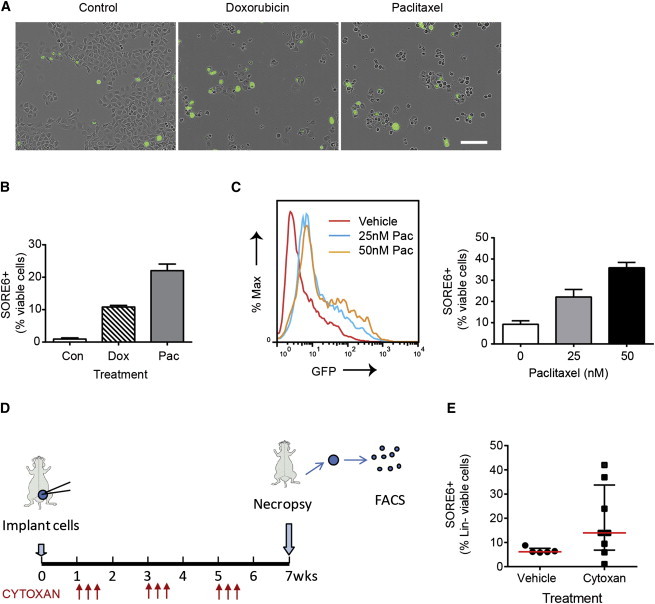
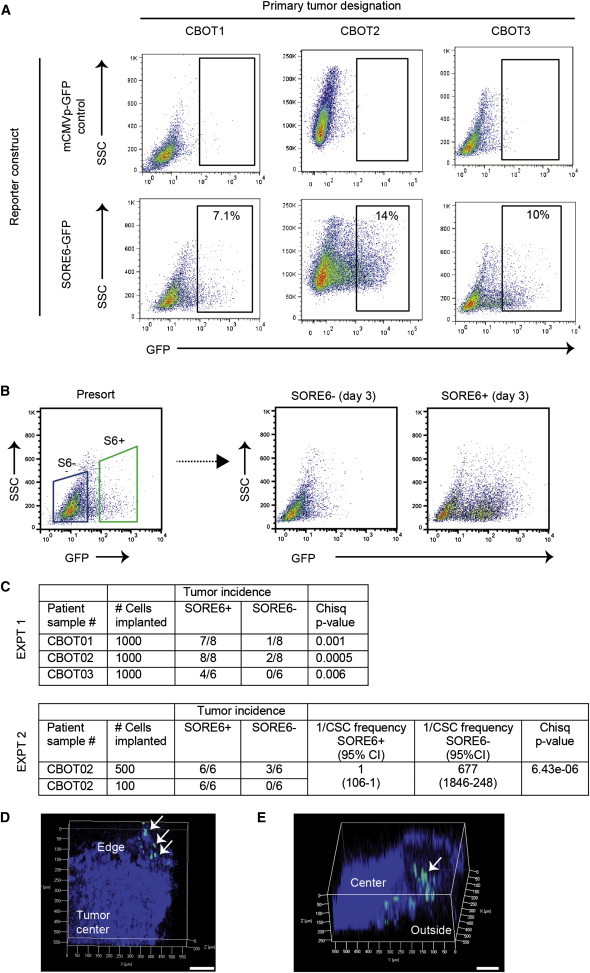
Many tumors are hierarchically organized with a minority cell population that has stem-like properties and enhanced ability to initiate tumorigenesis and drive therapeutic relapse. These cancer stem cells (CSCs) are typically identified by complex combinations of cell-surface markers that differ among tumor types. Here, we developed a flexible lentiviral-based reporter system that allows direct visualization of CSCs based on functional properties. The reporter responds to the core stem cell transcription factors OCT4 and SOX2, with further selectivity and kinetic resolution coming from use of a proteasome-targeting degron. Cancer cells marked by this reporter have the expected properties of self-renewal, generation of heterogeneous offspring, high tumor- and metastasis-initiating activity, and resistance to chemotherapeutics. With this approach, the spatial distribution of CSCs can be assessed in settings that retain microenvironmental and structural cues, and CSC plasticity and response to therapeutics can be monitored in real time.


Figures

None
Graphical abstract
Figure 1
Figure 1
The SORE6 Reporter Marks a Minority Cell Population that Is Enriched for Stem Cell Genes (A) Schematic of the lentiviral stem cell reporter. AttB1,B2,B4,B5 represent AttB sites for modular Gateway recombinational cloning. SORE is the SOX2/OCT4 composite response element. For details of other elements, see Supplemental Experimental Procedures. (B) FACS analysis showing activity of SORE6-GFP reporter in mouse ESCs with and without treatment with retinoic acid (RA) for 2 days to induce differentiation. (C) Quantitative RT-PCR assessing the expression of stem cell transcription factors in bulk culture of breast cancer cell lines, compared with the human teratocarcinoma line NT2 as a positive control. Results are normalized to PPIA and to the lowest-expressing cell line for each gene. (D) FACS analysis showing that the SORE6 reporter identifies a minority population in cultures of MCF10Ca1h cells. SSC, side scatter. (E) FACS analysis showing effect on SORE6 reporter activity of overexpressing OCT4 and/or SOX2 in MCF10Ca1h cells. (F) Quantitative RT-PCR to assess expression of master stem cell transcription factors in FACS-sorted SORE6+ and SORE6 cells, normalized to sham-sorted cells as the control. Results are mean ± SEM (n = 3 technical replicates). (G) Representation of SORE6+ cells in breast cancer cell lines of increasing malignancy. Results are mean ± SEM of three independent experiments. p < 0.05; ∗∗p < 0.01; ∗∗∗∗p < 0.0001, Student’s t test. See also Figure S1.
Figure 2
Figure 2
SORE6+ Cells Are Enriched for the Ability to Self-Renew, Generate Heterogeneous Offspring, Undergo Asymmetric Division, and Generate Tumorspheres (A) FACS plots showing that sorted SORE6+ MCF10Ca1h cells can regenerate SORE6 cells in culture. P1, first passage after sort; P2, second passage. (B) Fluorescent images showing sorted SORE6+ or SORE6 MCF10Ca1h cells after 5 days in culture. Cell nuclei are visualized with DAPI (blue), and SORE6+ cells are green. (C) MCF10Ca1h culture from (B) immunostained for cytokeratin 5 (CK5), cytokeratin 8 (CK8), or cytokeratin 14 (CK14). Scale bar, 20 μm. (D) Freeze frames from the time-lapse Movie S1 showing SORE6+ cells generating SORE6− offspring. MCF10Ca1h cultures enriched for SORE6+ cells followed by time-lapse videomicroscopy. In frame 1 (t = 6 hr), the single-headed arrow marks a small cluster of SORE6+ cells (cluster 1) and the double-headed arrow marks a doublet of SORE6+ and SORE6 cells (cluster 2). Frame 2 (t = 78 hr) shows that cluster 1, after undergoing several symmetric self-renewing divisions, has begun to generate SORE6 cells around the periphery of the colony. Cluster 2 has now generated a colony on the right that is predominantly SORE6, suggesting the SORE6 cells may proliferate faster than the SORE6+ cells. Frame 3 (t = 94 hr) and frame 4 (t = 112 hr) show that when cluster 2 expands to contact cluster 1, there is a rapid loss of SORE6+ cells in cluster 1. The group of predominantly SORE6+ cells marked by the dashed line in the top left of frame 4 has migrated in from outside of the field. Scale bar, 200 μm. (E) Asymmetric mitoses in FACS sorted SORE6+ and SORE6 or sham-sorted MCF10Ca1h cultures. Representative z stack image of asymmetrically distributed BrdU-labeled DNA in a pair of mitotic daughter cells and quantitation of asymmetric mitoses as % total mitoses. Results are mean ± SEM for three independent experiments, each evaluating 30–50 mitoses/condition. ∗∗∗p < 0.001; Student’s t test. (F) Tumorsphere formation by sorted SORE6+ and SORE6 or sham-sorted MCF10Ca1h cells. Results are mean ± SEM (three independent experiments). Representative phase-contrast images of tumorspheres are shown. (G) Fluorescent image of large tumorsphere derived from sorted SORE6+ MCF10Ca1h cells. Scale bar, 20 μm. See also Figures S2 and S3 and Movie S1.
Figure 3
Figure 3
SORE6+ Cells Are Enriched for Tumor- and Metastasis-Initiating Ability In Vivo and Can Be Visualized In Situ (A) Tumor-initiating ability of SORE6+ cells is maintained over multiple transplant generations. (B) H&E-stained sections showing histology of parental MCF10Ca1h tumors and tumors generated by SORE6+ cells after three serial passages in vivo. Scale bar, 50 μm. (C) Confocal z stack image showing spatial localization of SORE6+ cells in freshly excised MCF10Ca1h tumors. Tumor cells are constitutively marked in red, and SORE6+ cells are green. Arrows point to SORE6+ cells. Scale bar, 100 μm. (D) Confocal z stack image showing spatial localization of SORE6+ cells in MDA-MB-231 tumors. Note that here, tumor cells are constitutively marked in green, while SORE6+ cells are red. Arrows indicate yellow SORE6+ tumor cells. In this image, the red dots are not associated with nuclei and probably represent dead cell debris. Scale bar, 200 μm (left) or 40 μm (right). (E) Matrigel invasion assays using sorted SORE6+ and SORE6 and sham-sorted cells from MCF10Ca1h and MDA-MB-231 cultures. Results are mean ± SEM (n = 3 technical replicates). Representative images are shown for the MDA-MB-231 cells. Scale bar, 100 μm. (F) Lung metastases formed following tail-vein injection of sorted SORE6+ and SORE6 and sham-sorted cells from MDA-MB-231 cultures. Results are shown as median ± interquartile range for n = 5 mice/group. p < 0.05, two-way ANOVA. (G) Confocal z stack image of a lung metastasis derived from a SORE6+ MDA-MB-231 cell, showing rare yellow cells (some marked by arrows) that are positive for the SORE6 reporter. The tumor cells are constitutively marked with GFP, while the SORE6 reporter drives dsmCherry. Scale bar, 200 μm.
Figure 4
Figure 4
SORE6+ Cells Are Relatively Resistant to Chemotherapeutics (A) Cultures of MCF10Ca1h cells after 2 days of treatment with doxorubicin (50 nM) or paclitaxel (25 nM) showing selective killing of SORE6 cells. See also Movies S2 and S3. Scale bar, 200 μm. (B) Effect of treatment with doxorubicin (Dox; 50 nM) or paclitaxel (Pac; 25 nM) on the relative representation of SORE6+ cells in the MCF10Ca1h culture assessed by flow cytometry after 48 hr. Results are mean ± SEM for three technical replicate determinations. (C) FACS profile of MCF10Ca1h cells after 4 days of treatment with 25 nM or 50 nM paclitaxel (Pac), together with quantitation of SORE6+ cells by FACS analysis. Results are mean ± SEM for three technical replicates. (D) Schematic for treatment of MCF10Ca1h tumors with Cytoxan. (E) The effect of Cytoxan on SORE6+ cell representation in tumors from Cytoxan- or vehicle-treated mice. Results are median ± interquartile range for n = 5–8 mice/group. See also Movies S2 and S3.
Figure 5
Figure 5
The SORE6 Reporter Marks a Minority Population with Enhanced Tumor-Initiating Activity in Primary Cultures from Human Breast Cancer (A) Explant cultures of three independent primary human breast cancers were transduced with the SORE6-GFP reporter or minCMVp-GFP control lentivirus, and the SORE6+ population was assessed by FACS. (B) FACS plots showing that SORE6+ cells from the primary human breast cancer culture CBOT1 can regenerate significant numbers of SORE6 cells after 3 days in culture. (C) Relative enrichment of SORE6+ cells for tumor-initiating ability in the primary human breast cancer cultures, assessed by implantation of sorted cells in vivo. Two independent experiments were performed. In experiment #2, stem cell frequencies were calculated using ELDA software. (D) Confocal z stack image (50 μm depth) of freshly excised xenografted tumor derived from SORE6+ primary human breast cancer cells showing green SORE6+ cells in clusters at the edge of the tumor (arrows). Blue represents DAPI-stained nuclei. Scale bar, 100 μm. (E) Deeper (250 μm) confocal z stack image showing SORE6+ cells (arrow) at edge of tumor. Blue indicates tumor as visualized by second harmonic generation, since DAPI could not penetrate to sufficient depth. Scale bar, 100 μm.

Similar articles

Cited by

References

    1. Alison M.R., Lin W.R., Lim S.M., Nicholson L.J. Cancer stem cells: in the line of fire. Cancer Treat. Rev. 2012;38:589–598. - PubMed
    1. Arnold K., Sarkar A., Yram M.A., Polo J.M., Bronson R., Sengupta S., Seandel M., Geijsen N., Hochedlinger K. Sox2(+) adult stem and progenitor cells are important for tissue regeneration and survival of mice. Cell Stem Cell. 2011;9:317–329. - PMC - PubMed
    1. Atlasi Y., Mowla S.J., Ziaee S.A., Gokhale P.J., Andrews P.W. OCT4 spliced variants are differentially expressed in human pluripotent and nonpluripotent cells. Stem Cells. 2008;26:3068–3074. - PubMed
    1. Beltran A.S., Rivenbark A.G., Richardson B.T., Yuan X., Quian H., Hunt J.P., Zimmerman E., Graves L.M., Blancafort P. Generation of tumor-initiating cells by exogenous delivery of OCT4 transcription factor. Breast Cancer Res. 2011;13:R94. - PMC - PubMed
    1. Ben-Porath I., Thomson M.W., Carey V.J., Ge R., Bell G.W., Regev A., Weinberg R.A. An embryonic stem cell-like gene expression signature in poorly differentiated aggressive human tumors. Nat. Genet. 2008;40:499–507. - PMC - PubMed

Publication types

MeSH terms

Substances