

Mutations in G protein β subunits promote transformation and kinase inhibitor resistance
- PMID: 25485910
- PMCID: PMC4289115
- DOI: 10.1038/nm.3751
Mutations in G protein β subunits promote transformation and kinase inhibitor resistance
Abstract
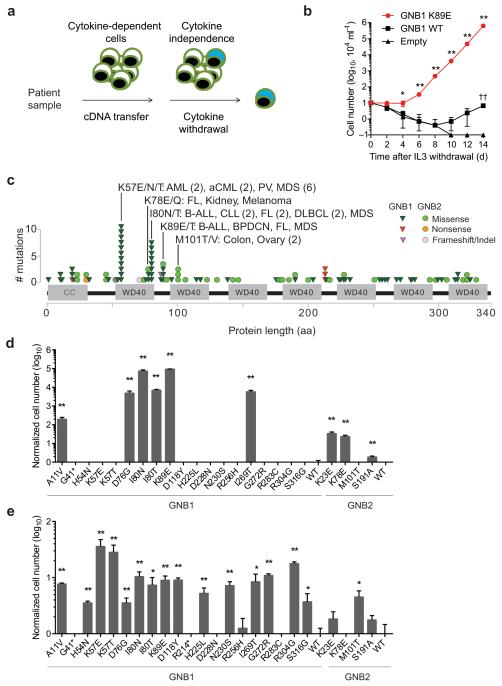
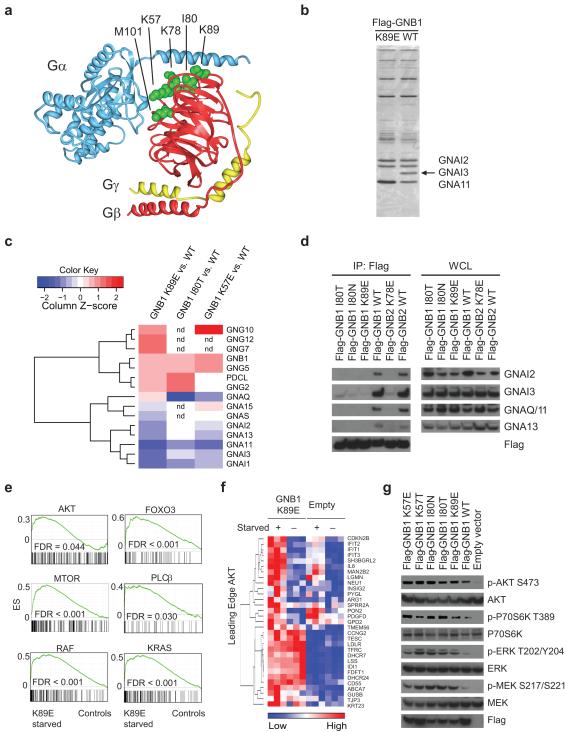
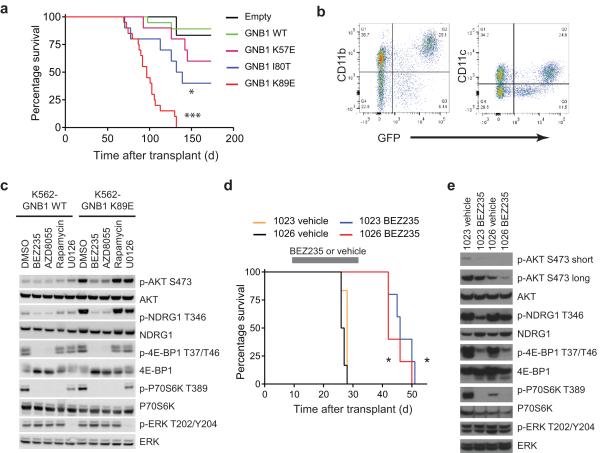
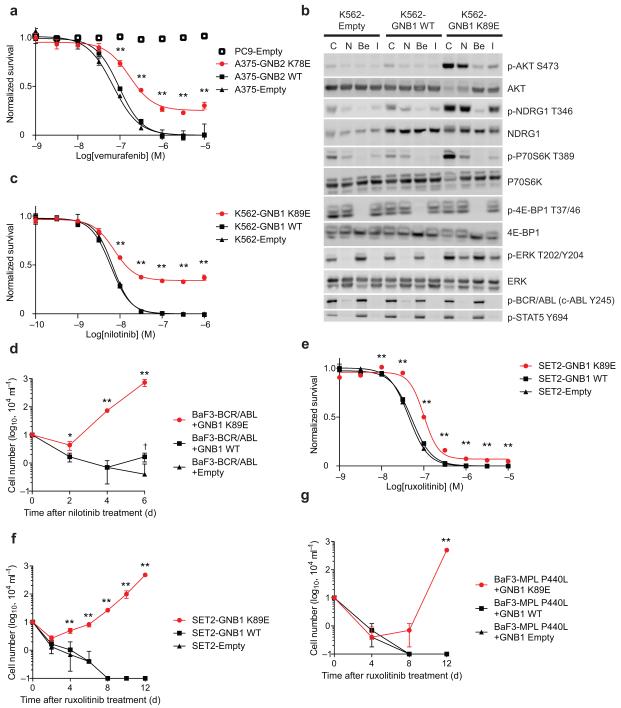
Activating mutations in genes encoding G protein α (Gα) subunits occur in 4-5% of all human cancers, but oncogenic alterations in Gβ subunits have not been defined. Here we demonstrate that recurrent mutations in the Gβ proteins GNB1 and GNB2 confer cytokine-independent growth and activate canonical G protein signaling. Multiple mutations in GNB1 affect the protein interface that binds Gα subunits as well as downstream effectors and disrupt Gα interactions with the Gβγ dimer. Different mutations in Gβ proteins clustered partly on the basis of lineage; for example, all 11 GNB1 K57 mutations were in myeloid neoplasms, and seven of eight GNB1 I80 mutations were in B cell neoplasms. Expression of patient-derived GNB1 variants in Cdkn2a-deficient mouse bone marrow followed by transplantation resulted in either myeloid or B cell malignancies. In vivo treatment with the dual PI3K-mTOR inhibitor BEZ235 suppressed GNB1-induced signaling and markedly increased survival. In several human tumors, mutations in the gene encoding GNB1 co-occurred with oncogenic kinase alterations, including the BCR-ABL fusion protein, the V617F substitution in JAK2 and the V600K substitution in BRAF. Coexpression of patient-derived GNB1 variants with these mutant kinases resulted in inhibitor resistance in each context. Thus, GNB1 and GNB2 alterations confer transformed and resistance phenotypes across a range of human tumors and may be targetable with inhibitors of G protein signaling.
Figures
Comment in
-
Oncogenes: nothing but a G thing.Nat Rev Cancer. 2015 Feb;15(2):68. doi: 10.1038/nrc3898. Nat Rev Cancer. 2015. PMID: 25614000 No abstract available.
Similar articles
-
An activating mutation of GNB1 is associated with resistance to tyrosine kinase inhibitors in ETV6-ABL1-positive leukemia.Oncogene. 2017 Oct 26;36(43):5985-5994. doi: 10.1038/onc.2017.210. Epub 2017 Jun 26. Oncogene. 2017. PMID: 28650474 Free PMC article.
-
Oncogenes: nothing but a G thing.Nat Rev Cancer. 2015 Feb;15(2):68. doi: 10.1038/nrc3898. Nat Rev Cancer. 2015. PMID: 25614000 No abstract available.
-
Targeting PIM kinases impairs survival of hematopoietic cells transformed by kinase inhibitor-sensitive and kinase inhibitor-resistant forms of Fms-like tyrosine kinase 3 and BCR/ABL.Cancer Res. 2006 Apr 1;66(7):3828-35. doi: 10.1158/0008-5472.CAN-05-2309. Cancer Res. 2006. PMID: 16585210
-
Refining the phenotype associated with GNB1 mutations: Clinical data on 18 newly identified patients and review of the literature.Am J Med Genet A. 2018 Nov;176(11):2259-2275. doi: 10.1002/ajmg.a.40472. Epub 2018 Sep 8. Am J Med Genet A. 2018. PMID: 30194818 Review.
-
Novel GNB1 de novo mutation in a patient with neurodevelopmental disorder and cutaneous mastocytosis: Clinical report and literature review.Eur J Med Genet. 2018 Mar;61(3):157-160. doi: 10.1016/j.ejmg.2017.11.010. Epub 2017 Nov 23. Eur J Med Genet. 2018. PMID: 29174093 Review.
Cited by
-
Unraveling the Molecular Nexus between GPCRs, ERS, and EMT.Mediators Inflamm. 2021 Mar 2;2021:6655417. doi: 10.1155/2021/6655417. eCollection 2021. Mediators Inflamm. 2021. PMID: 33746610 Free PMC article. Review.
-
MRTFB suppresses colorectal cancer development through regulating SPDL1 and MCAM.Proc Natl Acad Sci U S A. 2019 Nov 19;116(47):23625-23635. doi: 10.1073/pnas.1910413116. Epub 2019 Nov 5. Proc Natl Acad Sci U S A. 2019. PMID: 31690663 Free PMC article.
-
BCORL1 S878G, GNB1 G116S, SH2B3 A536T, and KMT2D S3708R tetramutation co-contribute to a pediatric acute myeloid leukemia: Case report and literature review.Front Pediatr. 2022 Oct 17;10:993952. doi: 10.3389/fped.2022.993952. eCollection 2022. Front Pediatr. 2022. PMID: 36324816 Free PMC article.
-
A novel somatic mutation in GNB2 provides new insights to the pathogenesis of Sturge-Weber syndrome.Hum Mol Genet. 2021 Oct 13;30(21):1919-1931. doi: 10.1093/hmg/ddab144. Hum Mol Genet. 2021. PMID: 34124757 Free PMC article.
-
Transcriptome 3'end organization by PCF11 links alternative polyadenylation to formation and neuronal differentiation of neuroblastoma.Nat Commun. 2018 Dec 14;9(1):5331. doi: 10.1038/s41467-018-07580-5. Nat Commun. 2018. PMID: 30552333 Free PMC article.
References
-
- Garraway LA, Lander ES. Lessons from the cancer genome. Cell. 2013;153:17–37. - PubMed
Publication types
MeSH terms
Substances
Grants and funding
LinkOut - more resources
Full Text Sources
Other Literature Sources
Molecular Biology Databases
Research Materials
Miscellaneous
