

Defining and measuring autophagosome flux—concept and reality
- PMID: 25484088
- PMCID: PMC4502790
- DOI: 10.4161/15548627.2014.973338
Defining and measuring autophagosome flux—concept and reality
Abstract
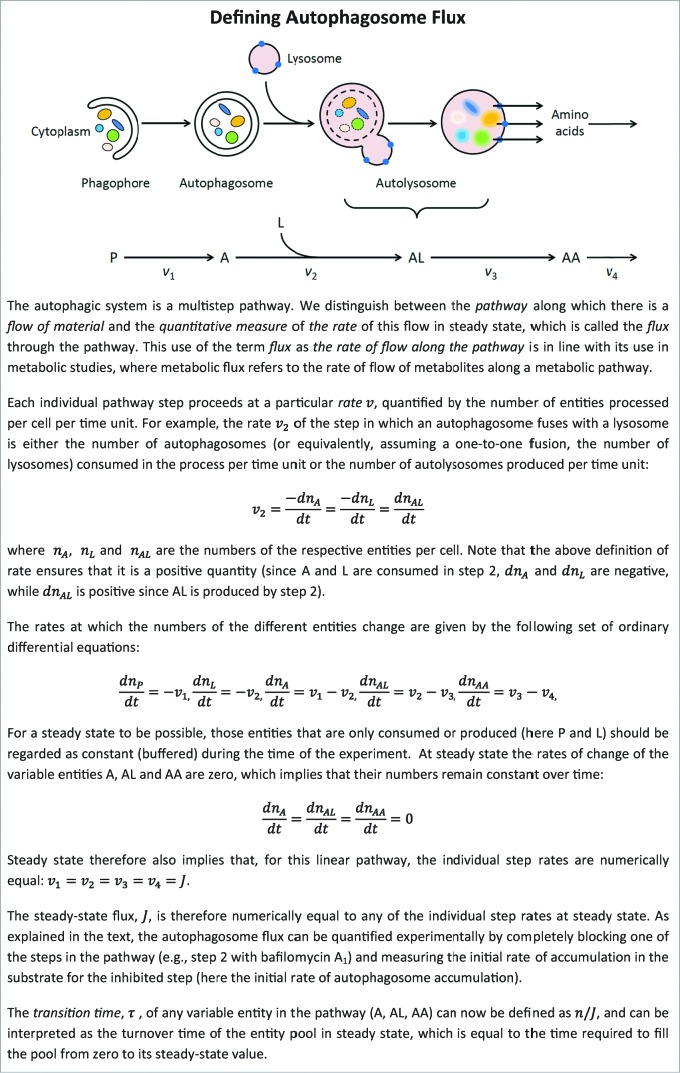
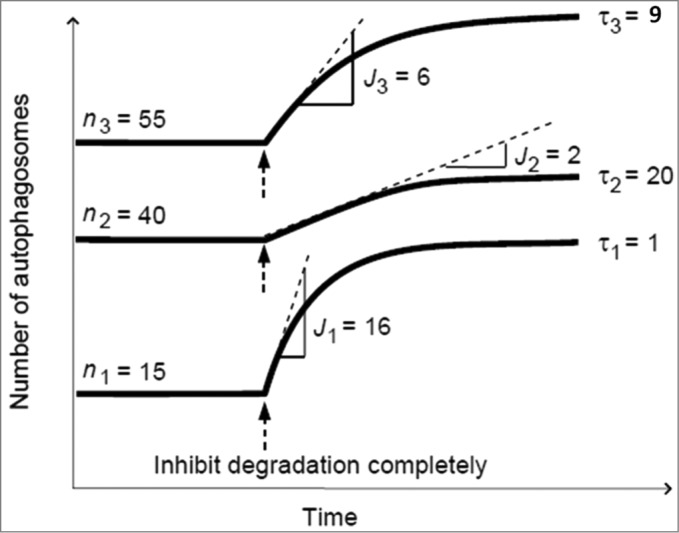
The autophagic system is involved in both bulk degradation of primarily long-lived cytoplasmic proteins as well as in selective degradation of cytoplasmic organelles. Autophagic flux is often defined as a measure of autophagic degradation activity, and a number of methods are currently utilized to assess autophagic flux. However, despite major advances in measuring various molecular aspects of the autophagic machinery, we remain less able to express autophagic flux in a highly sensitive, robust, and well-quantifiable manner. Here, we describe a conceptual framework for defining and measuring autophagosome flux at the single-cell level. The concept discussed here is based on the theoretical framework of metabolic control analysis, which distinguishes between the pathway along which there is a flow of material and the quantitative measure of this flow. By treating the autophagic system as a multistep pathway with each step characterized by a particular rate, we are able to provide a single-cell fluorescence live-cell imaging-based approach that describes the accurate assessment of the complete autophagosome pool size, the autophagosome flux, and the transition time required to turn over the intracellular autophagosome pool. In doing so, this perspective provides clarity on whether the system is at steady state or in a transient state moving towards a new steady state. It is hoped that this theoretical account of quantitatively measuring autophagosome flux may contribute towards a new direction in the field of autophagy, a standardized approach that allows the establishment of systematic flux databases of clinically relevant cell and tissue types that serve as important model systems for human pathologies.
Keywords: CMA, chaperone-mediated autophagy; GFP, green fluorescent protein; J, flux; LC3, microtubule-associated protein 1 light chain 3; TEM, transmission electron microscopy; nA, number of autophagosomes; τ, transition time.
Figures
Similar articles
-
Measuring autophagosome flux.Autophagy. 2018;14(6):1060-1071. doi: 10.1080/15548627.2018.1469590. Epub 2018 Jul 20. Autophagy. 2018. PMID: 29909716 Free PMC article.
-
On the relevance of precision autophagy flux control in vivo - Points of departure for clinical translation.Autophagy. 2020 Apr;16(4):750-762. doi: 10.1080/15548627.2019.1687211. Epub 2019 Nov 11. Autophagy. 2020. PMID: 31679454 Free PMC article.
-
An Autophagic Flux Probe that Releases an Internal Control.Mol Cell. 2016 Nov 17;64(4):835-849. doi: 10.1016/j.molcel.2016.09.037. Epub 2016 Nov 3. Mol Cell. 2016. PMID: 27818143
-
Autophagy: assays and artifacts.J Pathol. 2010 Jun;221(2):117-24. doi: 10.1002/path.2694. J Pathol. 2010. PMID: 20225337 Free PMC article. Review.
-
Evolution of tools and methods for monitoring autophagic flux in mammalian cells.Biochem Soc Trans. 2018 Feb 19;46(1):97-110. doi: 10.1042/BST20170102. Epub 2018 Jan 5. Biochem Soc Trans. 2018. PMID: 29305410 Review.
Cited by
-
Serum- and glucocorticoid- inducible kinase 2, SGK2, is a novel autophagy regulator and modulates platinum drugs response in cancer cells.Oncogene. 2020 Oct;39(40):6370-6386. doi: 10.1038/s41388-020-01433-6. Epub 2020 Aug 27. Oncogene. 2020. PMID: 32848212 Free PMC article.
-
Inhibition LC3B can increase chemosensitivity of ovarian cancer cells.Cancer Cell Int. 2019 Jul 29;19:199. doi: 10.1186/s12935-019-0921-z. eCollection 2019. Cancer Cell Int. 2019. PMID: 31384174 Free PMC article.
-
Activation of autophagy rescues synaptic and cognitive deficits in fragile X mice.Proc Natl Acad Sci U S A. 2018 Oct 9;115(41):E9707-E9716. doi: 10.1073/pnas.1808247115. Epub 2018 Sep 21. Proc Natl Acad Sci U S A. 2018. PMID: 30242133 Free PMC article.
-
Investigating the Role of Spermidine in a Model System of Alzheimer's Disease Using Correlative Microscopy and Super-resolution Techniques.Front Cell Dev Biol. 2022 May 17;10:819571. doi: 10.3389/fcell.2022.819571. eCollection 2022. Front Cell Dev Biol. 2022. PMID: 35656544 Free PMC article.
-
Dengue virus exploits autophagy vesicles and secretory pathways to promote transmission by human dendritic cells.Front Immunol. 2024 May 28;15:1260439. doi: 10.3389/fimmu.2024.1260439. eCollection 2024. Front Immunol. 2024. PMID: 38863700 Free PMC article.
References
-
- Klionsky DJ, Abdalla FC, Abeliovich H, Abraham RT, Acevedo-Arozena A, Adeli K,, et al. Guidelines for the use and interpretation of assays for monitoring autophagy. Autophagy 2012; 8:445-544; PMID:22966490; http://dx.doi.org/10.4161/auto.19496 - DOI - PMC - PubMed
-
- Kacser H, Burns JA. and Fell DA. The control of flux: 21 years on. Biochem. Soc. Trans. 1995; 23:341-366; PMID:7672373 - PubMed
-
- Hofmeyr J-HS. Metabolic control analysis in a nutshell, in Proc. of the 2nd International Conference on Systems Biology (Yi TM, Hucka M, Morohashi M. & Kitano H. (Eds.), Wisconsin: Omnipress, 2001; 291-300.
-
- Boland B, Kumar A, Lee S, Platt FM, Wegiel J, Yu WH, Nixon RA. Autophagy induction and autophagosome clearance in neurons: relationship to autophagic pathology in Alzheimer's disease. J Neurosci. 2008; 28:6926-37; PMID:18596167; http://dx.doi.org/10.1523/JNEUROSCI.0800-08.2008 - DOI - PMC - PubMed
-
- White E. Exploiting the bad eating habits of Ras-driven cancers. Genes Dev. 2013; 1;27(19):2065-71; PMID:24115766; .http://dx.doi.org/10.1101/gad.228122.113 - DOI - PMC - PubMed
Publication types
MeSH terms
Substances
LinkOut - more resources
Full Text Sources
Other Literature Sources
Research Materials