. 2014 Dec 4;10(12):e1004535.
doi: 10.1371/journal.ppat.1004535. eCollection 2014 Dec.

Cellular mechanisms of alpha herpesvirus egress: live cell fluorescence microscopy of pseudorabies virus exocytosis

Affiliations

Cellular mechanisms of alpha herpesvirus egress: live cell fluorescence microscopy of pseudorabies virus exocytosis

Ian B Hogue et al. PLoS Pathog. .

Abstract

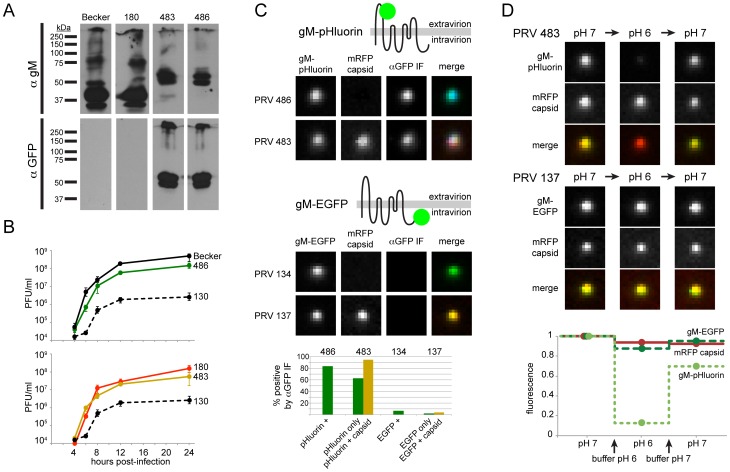
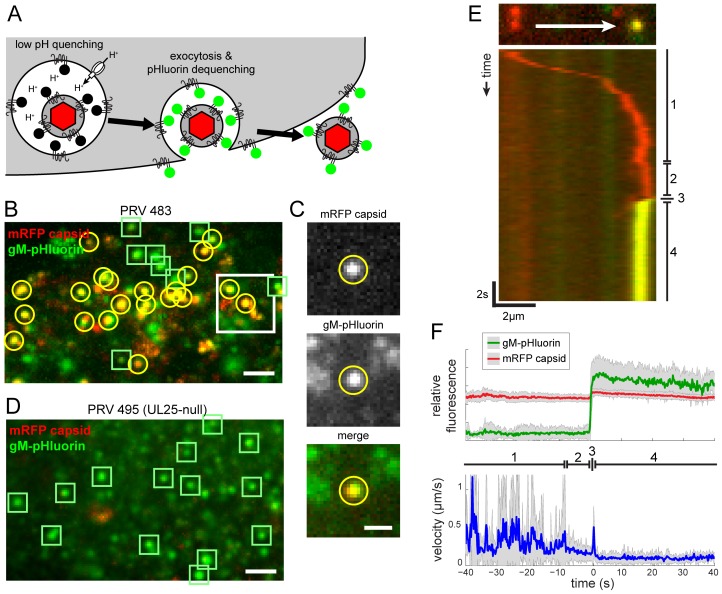
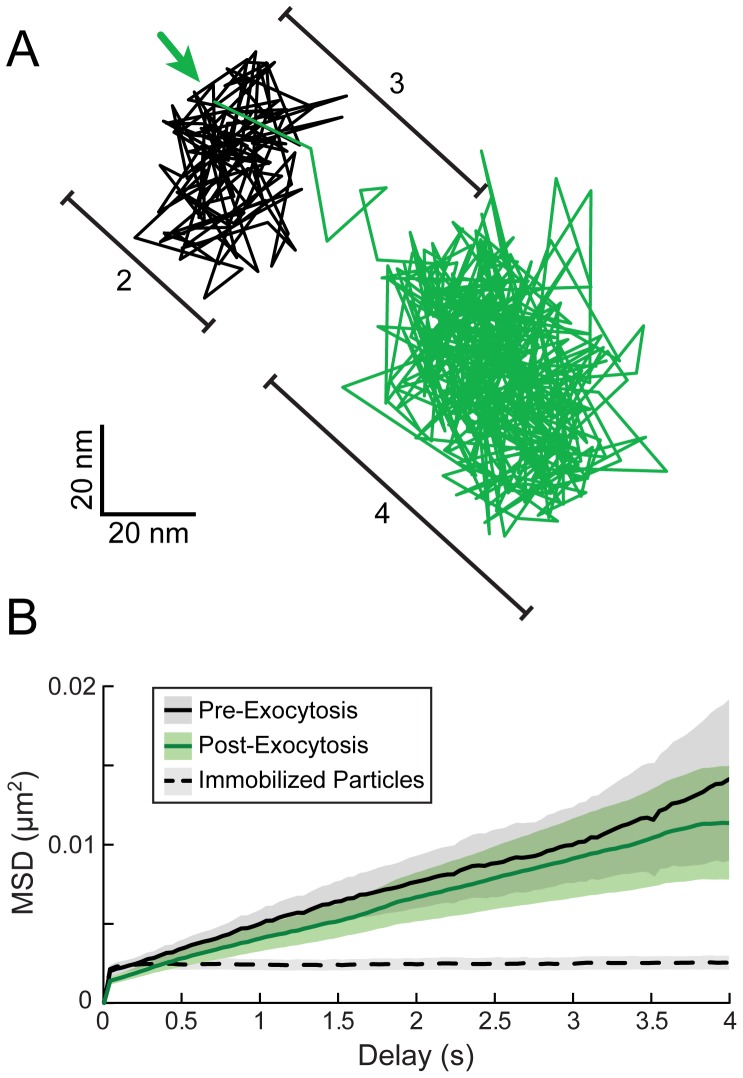
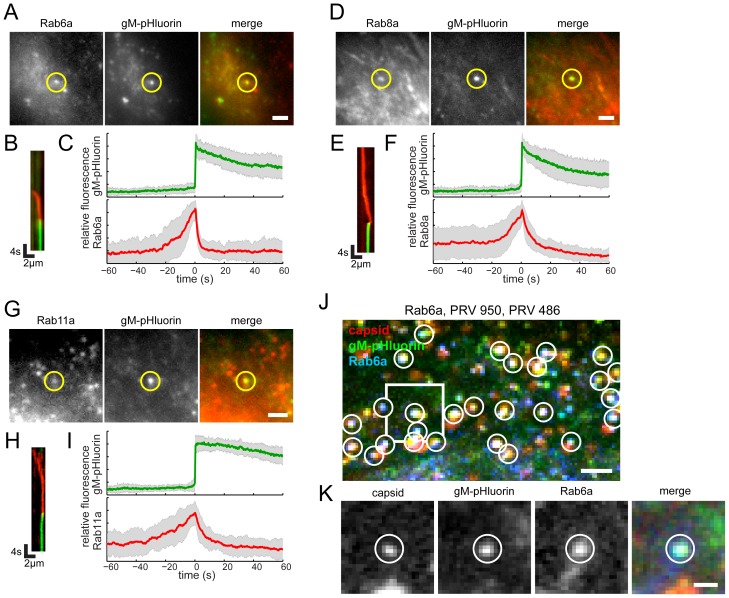
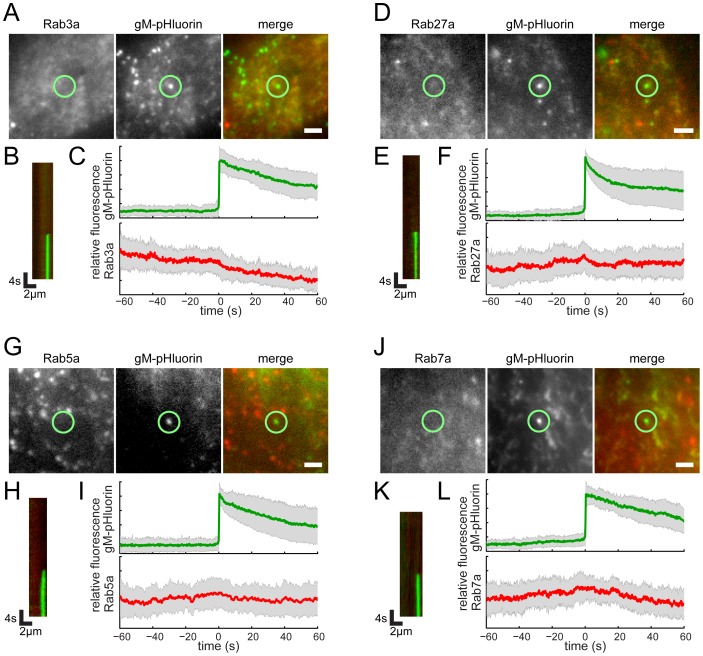
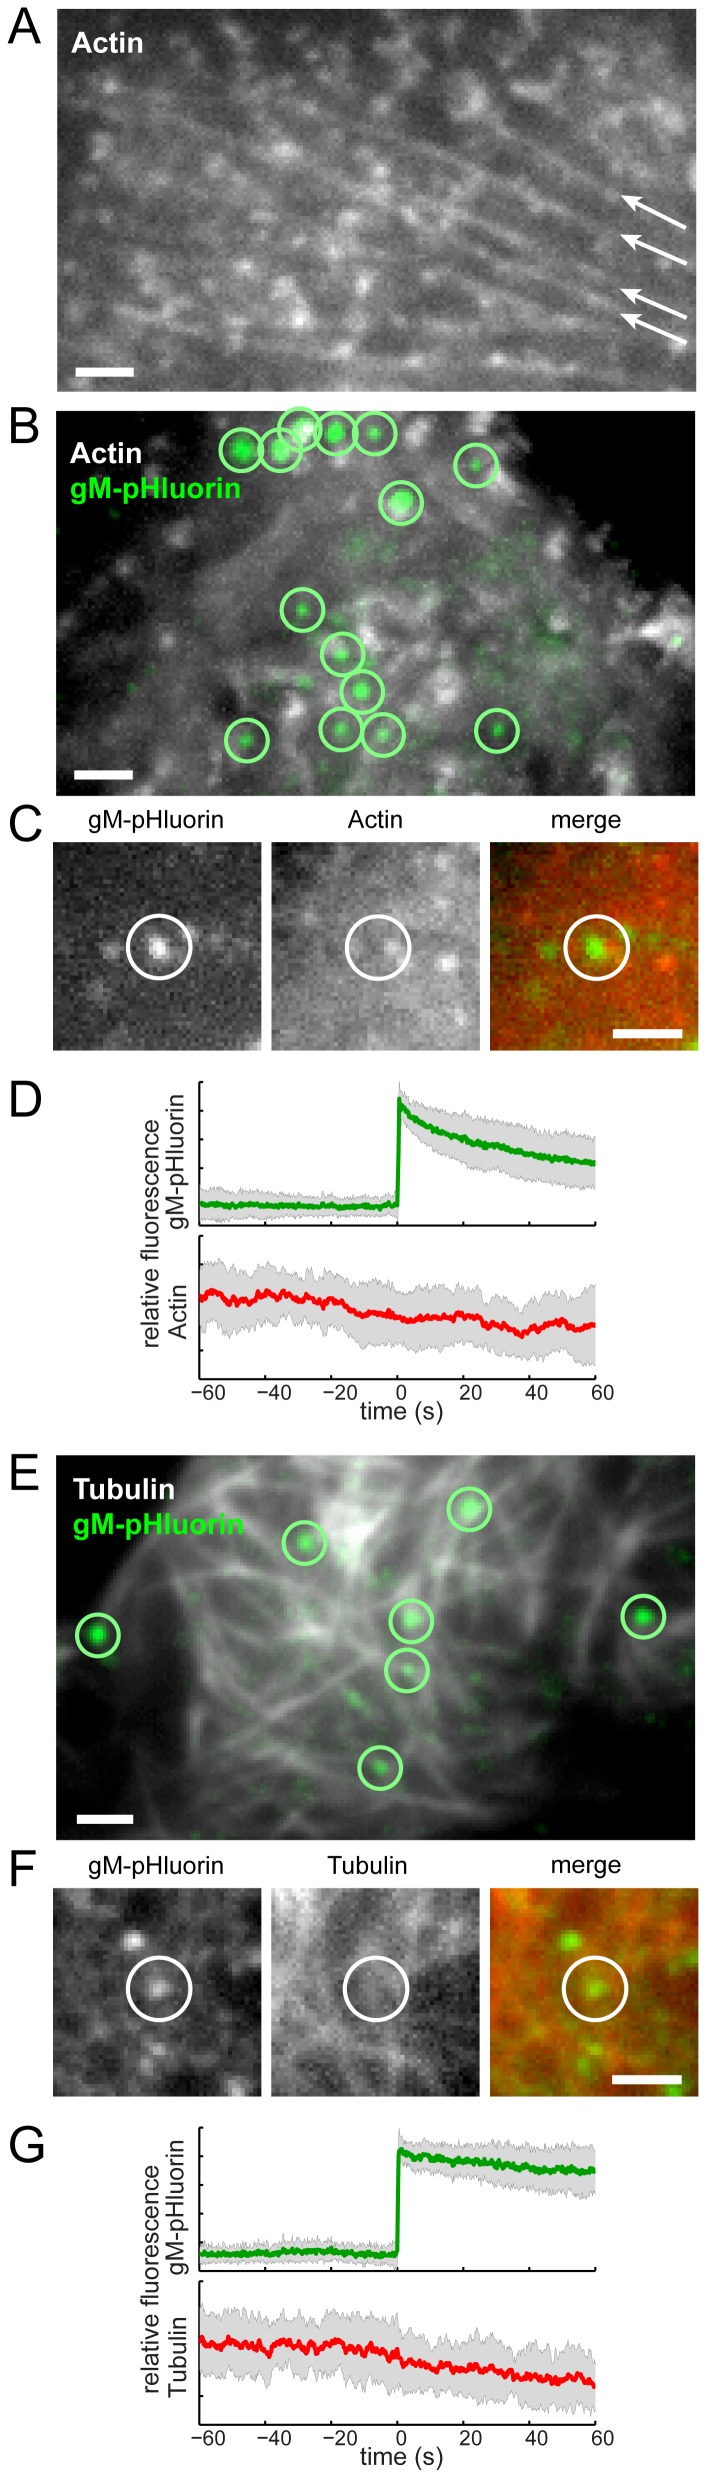
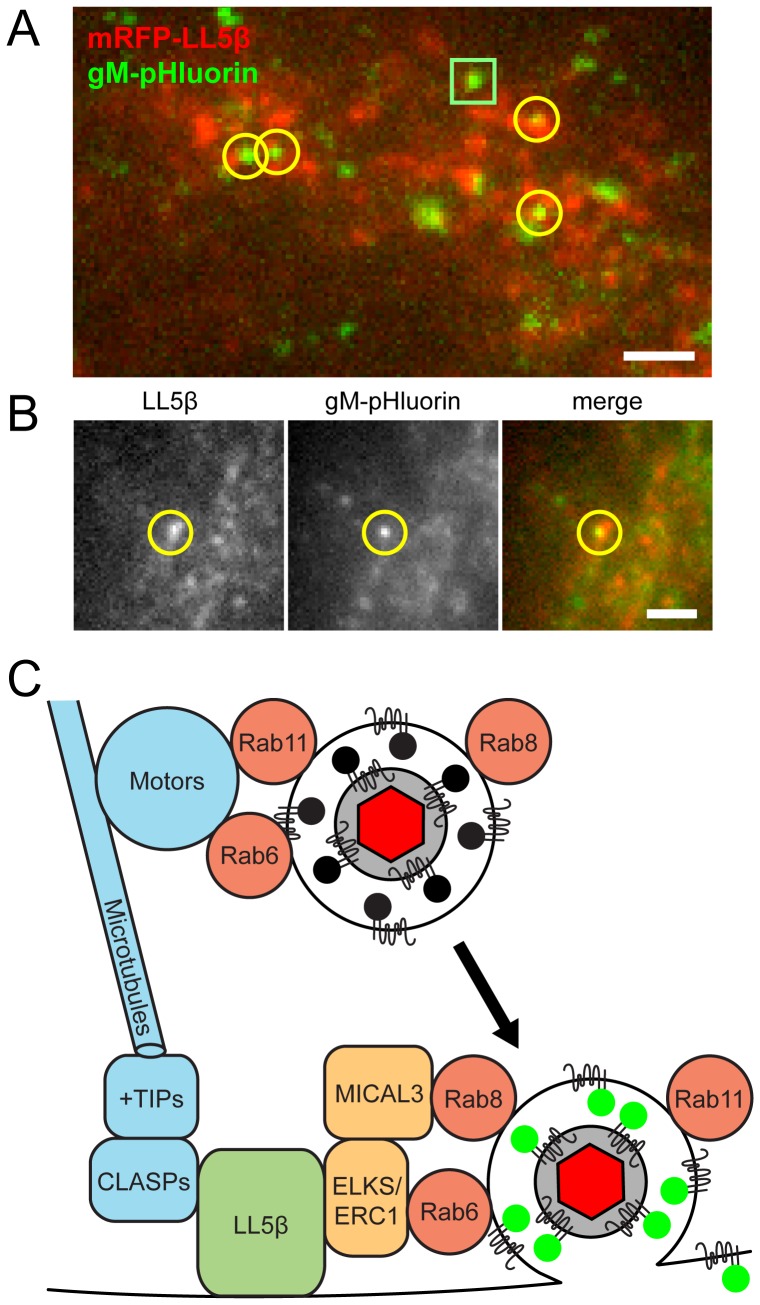
Egress of newly assembled herpesvirus particles from infected cells is a highly dynamic process involving the host secretory pathway working in concert with viral components. To elucidate the location, dynamics, and molecular mechanisms of alpha herpesvirus egress, we developed a live-cell fluorescence microscopy method to visualize the final transport and exocytosis of pseudorabies virus (PRV) particles in non-polarized epithelial cells. This method is based on total internal reflection fluorescence (TIRF) microscopy to selectively image fluorescent virus particles near the plasma membrane, and takes advantage of a virus-encoded pH-sensitive probe to visualize the precise moment and location of particle exocytosis. We performed single-particle tracking and mean squared displacement analysis to characterize particle motion, and imaged a panel of cellular proteins to identify those spatially and dynamically associated with viral exocytosis. Based on our data, individual virus particles travel to the plasma membrane inside small, acidified secretory vesicles. Rab GTPases, Rab6a, Rab8a, and Rab11a, key regulators of the plasma membrane-directed secretory pathway, are present on the virus secretory vesicle. These vesicles undergo fast, directional transport directly to the site of exocytosis, which is most frequently near patches of LL5β, part of a complex that anchors microtubules to the plasma membrane. Vesicles are tightly docked at the site of exocytosis for several seconds, and membrane fusion occurs, displacing the virion a small distance across the plasma membrane. After exocytosis, particles remain tightly confined on the outer cell surface. Based on recent reports in the cell biological and alpha herpesvirus literature, combined with our spatial and dynamic data on viral egress, we propose an integrated model that links together the intracellular transport pathways and exocytosis mechanisms that mediate alpha herpesvirus egress.


Conflict of interest statement

The authors have declared that no competing interests exist.

Figures

Figure 1
Figure 1. Characterization of PRV recombinants.
(A) Cells infected with parental viruses (PRV Becker, 180) or gM-pHluorin expressing viruses (PRV 483, 486) were harvested at 12 hpi, and lysates were analyzed by Western blot. Parallel blots were probed with polyclonal antiserum against gM (αgM), or a monoclonal antibody that recognizes pHluorin (αGFP). (B) Single-Step Virus Replication. Parallel cell cultures were infected in triplicate with the indicated parental viruses (PRV Becker, 180), gM-pHluorin expressing viruses (PRV 483, 486), or a gM-null virus (PRV 130). Cells and supernatants were harvested at indicated times, and infectious virus titer was measured by plaque assay. Error bars represent range. (C) Membrane Topology. Particles produced by the indicated viruses were imaged to detect gM-pHluorin or gM-EGFP, mRFP capsid, and immunofluorescence targeting the pHluorin or EGFP epitopes (αGFP IF). Immunofluorescence labeling was performed without membrane permeabilization. The schematic represents the predicted topology of gM-pHluorin or gM-EGFP. Images depict single representative virus particles (each image is 2.5 µm by 2.5 µm). Bar graph represents classification and quantification of particles based on fluorescence (n≥237 particles per condition). (D) pH Sensitivity. Particles produced by the indicated viruses were imaged to detect gM-pHluorin or gM-EGFP, and mRFP capsid after addition of buffers at pH 6 or 7. Images depict single representative virus particles (each image is 2.5 µm by 2.5 µm). Graph represents relative particle fluorescence after each indicated buffer change (n≥154 particles per condition).
Figure 2
Figure 2. Live-cell fluorescence microscopy of particle transport and egress.
(A) Schematic of virus particle transport and exocytosis assay. gM-pHluorin incorporated into virus particles or secretory vesicles is quenched in the acidic lumen of secretory vesicles (black circles), but the mRFP capsid tag is not (red hexagon). Upon exocytosis, pHluorin is exposed to neutral extracellular medium, and becomes fluorescent (green circles). (B) Virus particle exocytosis. PRV 483 infected cells were imaged at 4.5–5 hpi. Image is a maximum difference projection corresponding to Movie S1, depicting viral exocytosis events over a 13 min time course. Exocytosis of gM-pHluorin particles that do not contain capsids (green squares) and particles containing both gM-pHluorin and mRFP capsids (yellow circles) are indicated. Scale bar represents 2 µm. (C) Still images from Movie S1, depicting a single viral exocytosis event. Images correspond to the boxed area in panel B. Scale bar represents 1 µm. (D) Transcytosis of virus inoculum is almost never observed. Cells were infected with PRV 495 and imaged as in panel B. Image is a maximum difference projection corresponding to Movie S2, depicting exocytosis events over a 13 min time course. Exocytosis of gM-pHluorin particles that do not contain capsids are indicated by green squares. Particles containing mRFP capsids are almost never observed (not shown). Scale bar represents 2 µm. (E) Kymograph of a virus particle exocytosis event from Movie S1, depicting mRFP capsid (red) and gM-pHluorin (green) fluorescence over time. (F) Ensemble average of relative gM-pHluorin fluorescence (top, green line), mRFP capsid (top, red line), and instantaneous velocity (bottom, blue line) over 32 exocytosis events, in 10 cells, in 4 independent experiments. Shaded area represents standard deviation. (D and E) Virus particles exhibit stereotyped pattern of movement. (1) Fast directed transport. (2) Terminal pause. (3) Sharp jerk. (4) Mostly immobile.
Figure 3
Figure 3. High time-resolution tracking and MSD analysis of particle movement.
(A) PRV 483 infected cells were imaged at a rate of 25–50 frames/second, and particles were tracked before and after exocytosis. Graph shows one representative particle track, color-coded to indicate relative gM-pHluorin fluorescence. The location of gM-pHluorin dequenching is indicated (arrow). Bracketed regions correspond to pattern of movement indicated in Figure 2E and F: (2) Terminal pause. (3) Sharp jerk. (4) Mostly immobile. (B) Average MSD curves of particle tracks before and after exocytosis. Based on slope and MSD values, particles are confined an area approximately 400 nm in diameter before and after exocytosis (n = 43 exocytosis events, in 9 cells, in 3 independent experiments). Dotted MSD curve represents particles immobilized on glass (n = 249 particles). Shaded areas represent standard error of the mean.
Figure 4
Figure 4. Rabs associated with virus particle exocytosis.
Cells were transduced to express mCherry-tagged Rab proteins, infected with PRV 486 expressing gM-pHluorin, and imaged at 4.5–5 hr after PRV infection. (A,D,G) The indicated Rab proteins colocalize with gM-pHluorin particle at the moment of exocytosis (yellow circle). Images correspond to Movie S3. Scale bars represent 2 µm. (B,E,H) Kymographs of indicated Rab protein (red) and gM-pHluorin (green) fluorescence over time. (C,F,I) Ensemble averages of gM-pHluorin (top, green line) and indicated Rab protein (bottom, red line) relative fluorescence. Shaded area represents standard deviation. (A–C) mCherry-Rab6a. Data represent 37 exocytosis events in 4 independent experiments. (D–F) mCherry-Rab8a. Data represent 41 exocytosis events in 3 independent experiments. (G–I) mCherry-Rab11a. Data represent 34 exocytosis events in 3 independent experiments. (J–K) Rab6a is associated with exocytosis of assembled virions containing capsids. Cells were transduced to express mCherry-Rab6a, and co-infected with PRV 950 and PRV 486. (J) Image is a maximum difference projection corresponding to Movie S4, depicting virus particle exocytosis events over a 13.7 min time course. Exocytosis events associated with Rab6a (blue) containing gM-pHluorin (green) and capsids (red) are indicated (white circles). Scale bar represents 2 µm. (K) Still images from Movie S4, depicting a single viral exocytosis event. Images correspond to the boxed area in panel B. Scale bar represents 1 µm.
Figure 5
Figure 5. Rab proteins not associated with virus particle exocytosis.
Cells were transduced to express mCherry-tagged Rab proteins, infected with PRV 486 expressing gM-pHluorin, and imaged at 4.5–5 hr after PRV infection. (A,D,G,J) The indicated Rab proteins are not present at gM-pHluorin exocytosis event (green circle). Images correspond to Movie S5. Scale bar represents 2 µm. (B,E,H,K) Kymographs of indicated Rab protein (red) and gM-pHluorin (green) fluorescence over time. (C,F,I,L) Ensemble averages of gM-pHluorin (top, green line) and indicated Rab protein (bottom, red line) relative fluorescence. Shaded area represents standard deviation. (A–C) mCherry-Rab3a. Data represent 38 exocytosis events in 2 independent experiments. (D–F) mCherry-Rab27a. Data represent 23 exocytosis events in 2 independent experiments. (G–I) mCherry-Rab5a. Data represent 37 exocytosis events in 2 independent experiments. (J–L) mCherry-Rab7a. Data represent 30 exocytosis events in 2 independent experiments.
Figure 6
Figure 6. Viral exocytosis does not occur at specialized sites depleted in cytoskeleton proteins.
(A) Cells were transduced to express mCherry-actin. Long actin stress fibers are indicated (arrows). (B) Cells were transduced to express mCherry-actin, infected with PRV 486 expressing gM-pHluorin, and imaged at 4.5–5 hr after PRV infection. The image is a maximum difference projection depicting virus particle exocytosis events (green circles) over a 10.5 min time course. (C) Still images depicting a single exocytosis event in panel B. (D) Ensemble averages of gM-pHluorin (top, green line) and mCherry-actin (bottom, red line) relative fluorescence. Shaded area represents standard deviation. Data represent 34 exocytosis events in 3 independent experiments. (E) Cells were transduced to express mCherry-tubulin and infected with PRV as above. The image is a maximum difference projection depicting virus particle exocytosis events (green circles) over a 9 min time course. (F) Still images depicting a single exocytosis event in panel E. (G) Ensemble averages of gM-pHluorin (top, green line) and mCherry-tubulin (bottom, red line) relative fluorescence. Shaded area represents standard deviation. Data represent 24 exocytosis events in 3 independent experiments. Scale bars represent 2 µm in all images.
Figure 7
Figure 7. Viral exocytosis occurs most frequently near patches of LL5β.
(A–B) Cells were transduced to express mRFP-LL5β, infected with PRV 486 expressing gM-pHluorin, and imaged at 4.5–5 hr after PRV infection. Data represent 150 exocytosis events in 9 independent experiments. Scale bars represent 2 µm in all images. (A) Image is a maximum difference projection depicting exocytosis events over a 10 min time course. Particle exocytosis events are classified according to their proximity to mRFP-LL5β patches (yellow circles), or lack thereof (green squares). (B) Still images of a single exocytosis event, corresponding to Movie S6. (C) Schematic of molecular and cellular mechanisms that coordinate viral transport and exocytosis. Please refer to the discussion section for references supporting the depicted molecular links.

Similar articles

Cited by

References

    1. Mettenleiter TC, Müller F, Granzow H, Klupp BG (2013) The way out: what we know and do not know about herpesvirus nuclear egress. Cell Microbiol 15: 170–178 10.1111/cmi.12044 - DOI - PubMed
    1. Turcotte S, Letellier J, Lippé R (2005) Herpes simplex virus type 1 capsids transit by the trans-Golgi network, where viral glycoproteins accumulate independently of capsid egress. J Virol 79: 8847–8860 10.1128/JVI.79.14.8847-8860.2005 - DOI - PMC - PubMed
    1. Rémillard-Labrosse G, Lippé R (2009) Meeting of conventional and unconventional pathways at the TGN. Commun Integr Biol 2: 434–436. - PMC - PubMed
    1. Sugimoto K, Uema M, Sagara H, Tanaka M, Sata T, et al. (2008) Simultaneous tracking of capsid, tegument, and envelope protein localization in living cells infected with triply fluorescent herpes simplex virus 1. J Virol 82: 5198–5211 10.1128/JVI.02681-07 - DOI - PMC - PubMed
    1. Hollinshead M, Johns HL, Sayers CL, Gonzalez-Lopez C, Smith GL, et al. (2012) Endocytic tubules regulated by Rab GTPases 5 and 11 are used for envelopment of herpes simplex virus. EMBO J 31: 4204–4220 10.1038/emboj.2012.262 - DOI - PMC - PubMed

Publication types