. 2015 Feb 19;518(7539):422-6.
doi: 10.1038/nature13952. Epub 2014 Nov 26.

Dynamics of genomic clones in breast cancer patient xenografts at single-cell resolution

Affiliations

Dynamics of genomic clones in breast cancer patient xenografts at single-cell resolution

Peter Eirew et al. Nature. .

Abstract

Human cancers, including breast cancers, comprise clones differing in mutation content. Clones evolve dynamically in space and time following principles of Darwinian evolution, underpinning important emergent features such as drug resistance and metastasis. Human breast cancer xenoengraftment is used as a means of capturing and studying tumour biology, and breast tumour xenografts are generally assumed to be reasonable models of the originating tumours. However, the consequences and reproducibility of engraftment and propagation on the genomic clonal architecture of tumours have not been systematically examined at single-cell resolution. Here we show, using deep-genome and single-cell sequencing methods, the clonal dynamics of initial engraftment and subsequent serial propagation of primary and metastatic human breast cancers in immunodeficient mice. In all 15 cases examined, clonal selection on engraftment was observed in both primary and metastatic breast tumours, varying in degree from extreme selective engraftment of minor (<5% of starting population) clones to moderate, polyclonal engraftment. Furthermore, ongoing clonal dynamics during serial passaging is a feature of tumours experiencing modest initial selection. Through single-cell sequencing, we show that major mutation clusters estimated from tumour population sequencing relate predictably to the most abundant clonal genotypes, even in clonally complex and rapidly evolving cases. Finally, we show that similar clonal expansion patterns can emerge in independent grafts of the same starting tumour population, indicating that genomic aberrations can be reproducible determinants of evolutionary trajectories. Our results show that measurement of genomically defined clonal population dynamics will be highly informative for functional studies using patient-derived breast cancer xenoengraftment.


Conflict of interest statement

[Competing Interests] The authors declare that they have no competing financial interests.

Figures
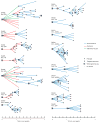
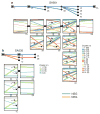
Figure E1
Figure E1
Transplant History. Diagrams show the transplant history of each xenograft line. Line segment colours represent the site used for each transplant (blue=subcutaneous, red=subrenal capsule, green=mammary fat pad). Black points indicate the passage of an engrafted xenograft to the next mouse generation. Grey crosses indicate transplants that did not result in palpable tumours. Samples analyzed by whole genome and/or targeted deep sequencing are indicated (black squares and vertical lines, respectively). The cumulative time in vivo is shown on the x-axis. The originating tumour site (Prim.=primary breast, Met.=pleural effusion) and immunohistochemical expression of biomarkers (ER=estrogen receptor, PR=progesterone receptor, TN=triple negative for ER, PR and HER2) are shown.
Figure E2
Figure E2
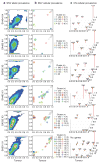
Comparison of the prevalence of mutations in six originating tumors and subsequent xenografts in SNV and CNA spaces. a, Density scatter plots showing the WGSS variant allele prevalence of genome-wide high-confidence SNVs in tumours (x-axis) and xenografts (y-axis). SNVs in clones undergoing neutral dynamics lie along a diagonal, and SNVs in clones undergoing expansion or contraction lie on/towards the y- and x-axes respectively. b, Scatter plots showing the mutation cellular prevalence of selected SNVs in tumours and xenografts, inferred by PyClone from population targeted deep sequencing. Circles represent individual SNVs, colours indicate clusters of mutations for which mutation cellular prevalences vary together over all sample time points. c, Scatter plots show co-occurrence of CNA/LOH events inferred by TITAN in tumours and xenografts. The z-axis height of each bar shows the number of genes belonging to a unique mutation cluster and present at the indicated mutation cellular prevalence in tumour (x-axis) and xenograft (y-axis).
Figure E3
Figure E3
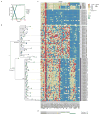
Single cell determination of clonal genotypes recapitulates population-based prediction of minor clone selection. DNA prepared from 62 individual SA494 tumor and 58 passage 4 xenograft nuclei was amplified in single reactions using a panel of multiplexed PCR primer pairs targeting amplicons containing 40 SNV and 7 germline variants, and the variant allele ratios were determined by targeted deep sequencing. a Mutation clusters inferred by the PyClone model from bulk population measurements. b, Bayesian phylogenetic tree derived from multi-locus genotypes of individual nuclei. The tumour and xenograft nuclei group in distinct clades. c, Heatmap depicts the multi-locus variant allele prevalences (blue/yellow/red corresponds to wild-type/heterozygous/homozygous loci) at variant positions (horizontal axis) in individual nuclei (vertical axis, ordered by phylogenetic grouping in (b)). Upper two blocks show genomic DNA controls and normal cell nuclei present in tumour sample. The PyClone mutation cluster corresponding to each SNV is indicated by colour in the lowermost horizontal bar. d, Consensus genotypes derived from high-probability splits in the phylogenetic tree confirm a set of high prevalence tumour-specific and xenograft-specific mutations, consistent with the expansion of a minor originating clone to dominance in the xenograft, as well as mutations shared in tumour and xenograft nuclei.
Figure E4
Figure E4
Clonal dynamics are reproduced in replicate transplants (2). a, b, c, Upper panels: passaging history of SA532, SA429, SA496, showing transplants that resulted in successful xenografts. The transplants sites (blue=SC, red=SR, green=MFP; all SC for SA532) and host mouse strains (blue=NSG, orange=NRG; all NSG for SA429 and SA496). Lower panels: change in cellular prevalence of mutation clusters over individual transplants. Plots correspond to passages in upper panels. The clusters are inferred by PyClone using grouped data from all passages, and correspond to those displayed in Figure 1. Arrows in SA429 and SA532 show examples of parallel clonal dynamics of the same mutation cluster in multiple replicate transplants. SA496 exhibits less replicated evolution compared with other cases.
Figure E5
Figure E5
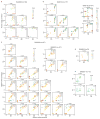
Correlation of clonal dynamics in replicate transplants of SA429, SA501, SA532, SA496 and SA535. a, b, c, d, e, Scatter plots display the inferred mutation cellular prevalence of all SNVs in pairs of same-passage replicates, for cases SA429, SA501, SA532, SA496 and SA535 respectively. For each replicate, prevalences are inferred by a separate PyClone analysis that excludes data from other same-passage transplants. Colours indicate mutation clusters inferred in each individual PyClone analyses; the SNVs clustered and colours assigned may differ in each plot. The Pearson correlation coefficients are shown, indicating closely related evolution in most pairs.
Figure 1
Figure 1
Clonal dynamics over multiple passages in time. Plots display the mean cellular prevalence estimates of mutation clusters in originating tumours (T) and subsequent xenograft passages (X1, X2, etc.). The clusters and prevalences were inferred by PyClone from population targeted deep sequencing. Line widths indicate the number of SNVs comprising each mutation cluster (numbers in brackets adjacent to each plot). Black lines indicate non-neutral dynamics, assessed by non-overlap of credible intervals derived from Bayesian posterior distributions (solid=non-neutral over indicated passage, dotted=over cumulative passages since initial transplant). All passages that underwent deep sequencing are shown. Transplant sites are represented by colour (blue=subcutaneous, red=subrenal, green=mammary fat pad), tumour and passages analyzed by WGSS are underlined. The panels are ordered by the degree of initial change in mutation cellular prevalence. Singleton clusters were not displayed for clarity.
Figure 2
Figure 2
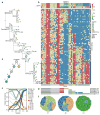
Single cell determination of clonal genotypes recapitulates population-based prediction of cascading subclonal evolution. DNA was prepared from 90 individual SA501 xenograft nuclei from passages X1, X2 and X4, and the variant allele ratios were determined by targeted ultra-deep sequencing at 45 somatic SNV and 10 germline SNV positions. a, Bayesian phylogenetic tree derived from multi-locus genotypes of individual nuclei, depicting cascading evolution. b, Heatmap depicting multilocus variant allele ratios (blue/yellow/red corresponds to wild-type/heterozygous/homozygous loci). Nuclei (y-axis) are ordered according to the phylogenetic tree in (a). Positions (x-axis) are grouped according to the consensus genotypes derived from high-probability branch splits in a manner naive to the PyClone clustering. The cluster groupings (horizontal bar below horizontal axis) recapitulate the PyClone groupings inferred from bulk population measurements (c). d, Five consensus genotypes derived from high-probability splits in the phylogenetic tree. e, Schematic of the phylogeny derived from single cell genotyping depicts the sequential expansion of genomic subclones. Genotypes are coloured according to the last Py-Clone mutation cluster acquired at a given point in the phylogeny. f, Schematic representations of xenograft tumours X1, X2, and X4 based on single cell genotypes. Cells are coloured according to their genotype in (e), and the number of cells within each schematic corresponds to the number of sequenced nuclei with the given genotype in (b). The relative proportions of cells with each genotype reflect predictions based on bulk measurements in (c).
Figure 3
Figure 3
Clonal dynamics are reproduced in replicate transplants (1). a, b, Upper panels: Passaging history of SA501, SA535 showing transplants that resulted in successful xenografts. The host mouse strains (blue=NSG, orange=NRG) are indicated. All transplants were in subcutaneous site. Lower panels: change in cellular prevalence of mutation clusters over individual transplants. Plots correspond to passages in upper panels. The clusters are inferred by PyClone using grouped data from all passages, and correspond to those displayed in Figure 1. Arrows show examples of parallel clonal dynamics of the same mutation cluster in multiple replicate transplants.

Comment in

Similar articles

  • The clonal and mutational evolution spectrum of primary triple-negative breast cancers.
    Shah SP, Roth A, Goya R, Oloumi A, Ha G, Zhao Y, Turashvili G, Ding J, Tse K, Haffari G, Bashashati A, Prentice LM, Khattra J, Burleigh A, Yap D, Bernard V, McPherson A, Shumansky K, Crisan A, Giuliany R, Heravi-Moussavi A, Rosner J, Lai D, Birol I, Varhol R, Tam A, Dhalla N, Zeng T, Ma K, Chan SK, Griffith M, Moradian A, Cheng SW, Morin GB, Watson P, Gelmon K, Chia S, Chin SF, Curtis C, Rueda OM, Pharoah PD, Damaraju S, Mackey J, Hoon K, Harkins T, Tadigotla V, Sigaroudinia M, Gascard P, Tlsty T, Costello JF, Meyer IM, Eaves CJ, Wasserman WW, Jones S, Huntsman D, Hirst M, Caldas C, Marra MA, Aparicio S. Shah SP, et al. Nature. 2012 Apr 4;486(7403):395-9. doi: 10.1038/nature10933. Nature. 2012. PMID: 22495314 Free PMC article.
  • Clonal evolution in cancer: a tale of twisted twines.
    Janiszewska M, Polyak K. Janiszewska M, et al. Cell Stem Cell. 2015 Jan 8;16(1):11-2. doi: 10.1016/j.stem.2014.12.011. Cell Stem Cell. 2015. PMID: 25575078
  • Breast tumours maintain a reservoir of subclonal diversity during expansion.
    Minussi DC, Nicholson MD, Ye H, Davis A, Wang K, Baker T, Tarabichi M, Sei E, Du H, Rabbani M, Peng C, Hu M, Bai S, Lin YW, Schalck A, Multani A, Ma J, McDonald TO, Casasent A, Barrera A, Chen H, Lim B, Arun B, Meric-Bernstam F, Van Loo P, Michor F, Navin NE. Minussi DC, et al. Nature. 2021 Apr;592(7853):302-308. doi: 10.1038/s41586-021-03357-x. Epub 2021 Mar 24. Nature. 2021. PMID: 33762732 Free PMC article.
  • Clonal evolution in cancer.
    Greaves M, Maley CC. Greaves M, et al. Nature. 2012 Jan 18;481(7381):306-13. doi: 10.1038/nature10762. Nature. 2012. PMID: 22258609 Free PMC article. Review.
  • Patient-derived xenograft models of breast cancer and their predictive power.
    Whittle JR, Lewis MT, Lindeman GJ, Visvader JE. Whittle JR, et al. Breast Cancer Res. 2015 Feb 10;17(1):17. doi: 10.1186/s13058-015-0523-1. Breast Cancer Res. 2015. PMID: 25849559 Free PMC article. Review.

Cited by

References

    1. Aparicio S, Caldas C. The implications of clonal genome evolution for cancer medicine. N Engl J Med. 2013;368:842–51. - PubMed
    1. Nowell PC. The clonal evolution of tumor cell populations. Science (New York, NY) 1976;194:23–28. - PubMed
    1. Diaz LA, Jr, et al. Nature. 2012;486:537–40. - PMC - PubMed
    1. Shah SP, et al. The clonal and mutational evolution spectrum of primary triple-negative breast cancers. Nature. 2012;486:395–9. - PMC - PubMed
    1. Gerlinger M, et al. Intratumor heterogeneity and branched evolution revealed by multiregion sequencing. The New England journal of medicine. 2012;366:883–892. - PMC - PubMed

Publication types