Review
. 2015 Jan 15:105:536-51.
doi: 10.1016/j.neuroimage.2014.10.044. Epub 2014 Oct 24.

Recent progress and outstanding issues in motion correction in resting state fMRI

Affiliations
Review

Recent progress and outstanding issues in motion correction in resting state fMRI

Jonathan D Power et al. Neuroimage. .

Abstract

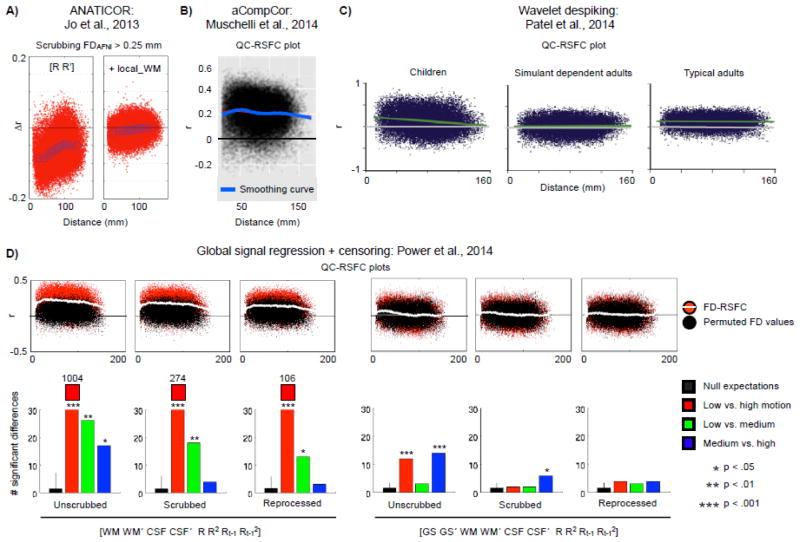
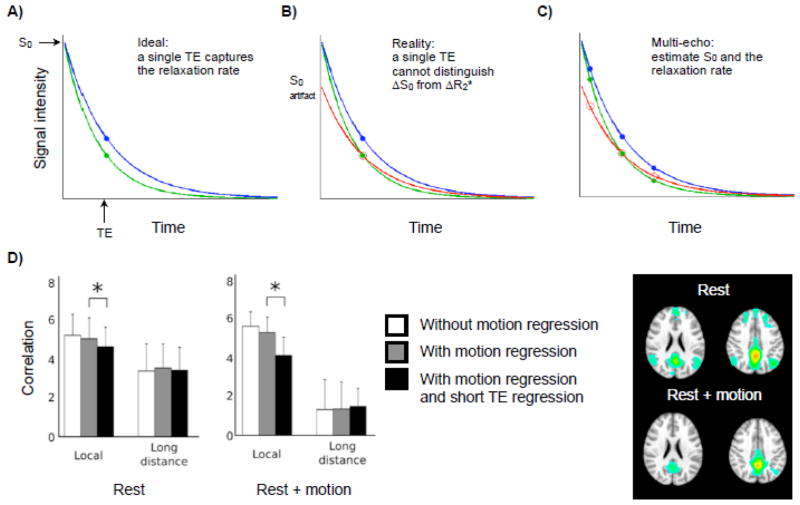
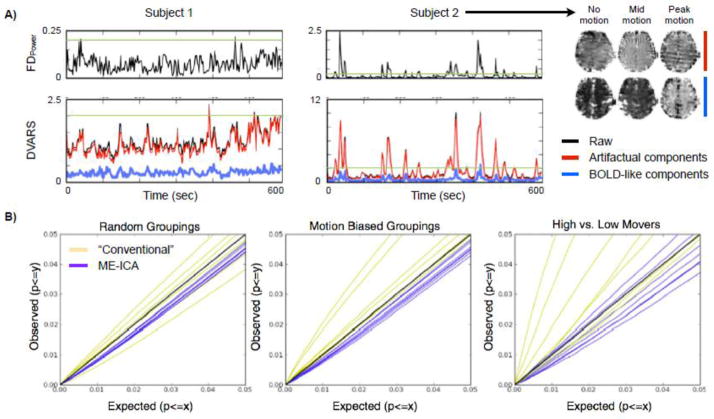
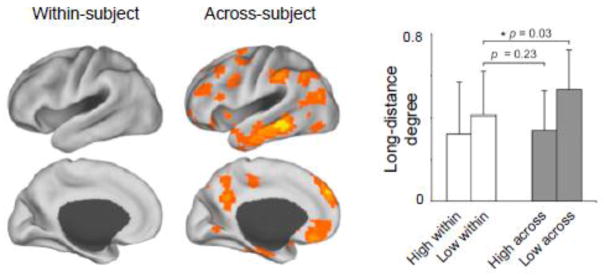
The purpose of this review is to communicate and synthesize recent findings related to motion artifact in resting state fMRI. In 2011, three groups reported that small head movements produced spurious but structured noise in brain scans, causing distance-dependent changes in signal correlations. This finding has prompted both methods development and the re-examination of prior findings with more stringent motion correction. Since 2011, over a dozen papers have been published specifically on motion artifact in resting state fMRI. We will attempt to distill these papers to their most essential content. We will point out some aspects of motion artifact that are easily or often overlooked. Throughout the review, we will highlight gaps in current knowledge and avenues for future research.

Keywords: Artifact; Denoising; Functional connectivity; Motion; Resting state; fMRI.


Conflict of interest statement

Conflict of Interest Statement:

The authors have no conflicts of interest to report.

The authors have no conflicts of interest to report.

Figures

Figure 1
Figure 1. Measuring motion
A) For a single subject, realignment estimates, framewise displacement, absolute-rotational and translational displacements, and a DVARS trace calculated over the whole brain. Absolute displacements are the sum of the absolute values of the 3 translational and 3 rotational parameters, respectively. Framewise displacement is the sum of the absolute values of the first derivatives of the 6 realignment parameters, after converting the rotational parameters to translational displacements on a sphere of radius 50 mm (roughly the radius of the brain). DVARS is calculated as the RMS value, at each volume, of the first derivatives of all voxel timeseries over the whole brain. The TR is 2.5 seconds. Modified from (Power et al., 2014). B) Comparisons of various FD measures, modified from (Yan et al., 2013a).
Figure 2
Figure 2. Signal disruptions by motion
A) Modeling of the global signal during and after motion, for 3 magnitudes of motion, and a voxelwise map of modeled changes at the most severe level of motion. Modified from (Satterthwaite et al., 2013a). B) For two subjects, motion traces and gray matter voxel timeseries are shown, illustrating the heterogeneity and duration of motion’s impact on fMRI signal. The TR is 2.5 seconds, meaning the black scaling bar covers 25 seconds. These data have only been slice time corrected (for interleaved acquisition), realigned, registered to a target atlas, and the mean signal at each voxel has been subtracted, i.e., no frequency filtering or nuisance regression or other denoising has been performed. The dotted lines roughly denote FD = 0.5 and FD = 0.2 mm. Modified from (Power et al., 2014). Note that, within a single dataset. measured magnitudes of FDFSL are roughly half the magnitudes of FDpower.
Figure 3
Figure 3. Spatial aspects of motion artifact’s impact on correlations
A) QC-RSFC correlations across hundreds of adult subjects, where the QC measure is FDFSL, modified from (Satterthwaite et al., 2013a).B) Scrubbing analyses of FDpower >0.5 mm, modified from (Power et al., 2012). C) The locations of the top 2% of changed correlations in Figure 3B, with blue and red colors representing correlations that are decreased and increased, respectively, by scrubbing D) Projections of the top 3% of changed correlations of Figure 3B onto the X, Y, and Z axes.
Figure 4
Figure 4. Effects of different regressors on gray matter signals
At top, the data from the 2 subjects shown in Figure 2. The middle 3 gray panels show the effect of regressing increasing numbers of motion parameters. The bottom panel shows the effect of regressing the global signal. WM: white matter signal; CSF: ventricle signal; GS: global signal; R: realignment estimates. The 12 motion parameters are [R R′], the 24 are [R R2 Rt-1 Rt-12], and the 36 are [R R2 Rt-1 Rt-12 Rt-2 Rt-22]. Modified from (Power et al., 2014).
Figure 5
Figure 5. Removal of motion artifact under various processing strategies
A) Scrubbing analyses of volumes with FDAFNI > 0.25 mm, when regressing only 12 motion parameters or the 12 motion parameters and a local white matter regressor derived by ANATICOR. B) QC-RSFC correlations after applying aCompCor to a dataset C) QC-RSFC correlations in 3 datasets after wavelet despiking. D) QC-RSFC correlations in 120 adults under processing streams including or excluding global signal regression. “Unscrubbed” data have undergone the indicated regression, followed by temporal filtering and spatial blurring. “Scrubbed” data are obtained by censoring “unscrubbed” data with FDPOWER > 0.2 mm as a threshold. “Reprocessed” data undergo identical censoring, except the censored volumes are also withheld from the nuisance regression calculations and are interpolated over prior to temporal filtering. The bar charts indicate the number of significant differences amoiig 40-subject cohorts of motion-binned adults, identified by two-sample, two-tailed t-tests with p< 0.0005. 10,000 permutations of FD values across subjects established null expectations and significance levels for these comparisons. WM: white matter signal;CSF: ventricle signal; GS: global signal; R: realignment estimates.
Figure 6
Figure 6. Using multi-echo sequences to remove motion artifact
A–C) Schematic illustrations of the advantages of multi-echo sequences over single-echo sequences for identifying ΔS0-related artifact. D) Data from the dual-echo study of Bright and colleagues. Bar plots show correlations between regions of the default mode network in conditions of normal rest and purposeful movement, without and with short-TE signal regression. Slices show seed correlation maps for the posterior cingulate after short-TE signal regression in conditions of low and high motion. Modified from (Bright and Murphy, 2013)
Figure 7
Figure 7. Motion artifact reduction in the multi-echo ICA approach
A) FD and DVARS traces from 2 subjects. The y-axis scales differ between subjects, and green lines have been placed to aid comparison of the traces. Red and blue traces indicate “bad” (ΔS0-related) and “good” (ΔR2*-related) ICA components derived from ME-ICA. The slices at right illustrate the two types of components in Subject 2 at different timepoints in the scan. B) Observed vs. expected numbers of significant differences in several seed maps under “conventional” and multi-echo (ME-ICA) processing strategies. Each line represents a single seed map, where observed numbers of voxels surpassing a statistical threshold for group differences are plotted against null expecations for such differences. Lines above the black line (y=x) indicate that seed maps had greater-than-chance numbers of significantly drfferent voxels. Modified from (Kundu et al., 2013)
Figure 8
Figure 8. Motion-related differences within and across subjects
At left, contrast images of long-distance degree. The within-subject contrast is between high- and low-motion scans within the same subjects, the across-subject contrast is between demographically and motion-matched scans that were acquired across subjects. Overall differences are quantified in the bar graph. Modified from (Zeng et al, 2014).

Similar articles

Cited by

References

    1. Andrews-Hanna JR, Snyder AZ, Vincent JL, Lustig C, Head D, Raichle ME, Buckner RL. Disruption of large-scale brain systems in advanced aging. Neuron. 2007;56:924–935. - PMC - PubMed
    1. Barch DM, Sabb FW, Carter CS, Braver TS, Noll DC, Cohen JD. Overt verbal responding during fMRI scanning: empirical investigations of problems and potential solutions. NeuroImage. 1999;10:642–657. - PubMed
    1. Beall EB, Lowe MJ. SimPACE: Generating simulated motion corrupted BOLD data with synthetic-navigated acquisition for the development and evaluation of SLOMOCO: A new, highly effective slicewise motion correction. NeuroImage. 2014;101:21–34. - PMC - PubMed
    1. Behzadi Y, Restom K, Liau J, Liu TT. A component based noise correction method (CompCor) for BOLD and perfusion based fMRI. NeuroImage. 2007;37:90–101. - PMC - PubMed
    1. Bianciardi M, Fukunaga M, van Gelderen P, Horovitz SG, de Zwart JA, Shmueli K, Duyn JH. Sources of functional magnetic resonance imaging signal fluctuations in the human brain at rest: a 7 T study. Magnetic resonance imaging. 2009;27:1019–1029. - PMC - PubMed

Publication types