. 2014 Dec 4;15(6):707-19.
doi: 10.1016/j.stem.2014.09.019. Epub 2014 Oct 16.

m(6)A RNA modification controls cell fate transition in mammalian embryonic stem cells

Affiliations

m(6)A RNA modification controls cell fate transition in mammalian embryonic stem cells

Pedro J Batista et al. Cell Stem Cell. .

Abstract

N6-methyl-adenosine (m(6)A) is the most abundant modification on messenger RNAs and is linked to human diseases, but its functions in mammalian development are poorly understood. Here we reveal the evolutionary conservation and function of m(6)A by mapping the m(6)A methylome in mouse and human embryonic stem cells. Thousands of messenger and long noncoding RNAs show conserved m(6)A modification, including transcripts encoding core pluripotency transcription factors. m(6)A is enriched over 3' untranslated regions at defined sequence motifs and marks unstable transcripts, including transcripts turned over upon differentiation. Genetic inactivation or depletion of mouse and human Mettl3, one of the m(6)A methylases, led to m(6)A erasure on select target genes, prolonged Nanog expression upon differentiation, and impaired ESC exit from self-renewal toward differentiation into several lineages in vitro and in vivo. Thus, m(6)A is a mark of transcriptome flexibility required for stem cells to differentiate to specific lineages.


Figures

Figure 1
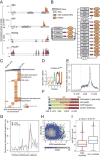
Figure 1. Topology and characterization of m6A target genes
(A) UCSC Genome browser plots of m6A-seq reads along indicated mRNAs. Grey reads are from non-immunoprecipitated input libraries and red reads from anti-m6A immunoprecipitation libraries. The y-axis represents normalized number of reads. Blue thick boxes represent the open reading frame while the blue line represents the untranslated regions. See also Figure S1A and Table S1 and S2. (B) Model of genes involved in maintenance of stem cell state (adapted from Young et al., 2011). Red hexagons represent modified mRNAs. (C) Heatmap with log10 (p-vlaue) of gene set enrichment analysis for m6A modified genes. (D) Sequence motif identified after analysis of m6A enrichment regions. See also Figure S1B, S1C. (E) Normalized distribution of m6A peaks across 5′ UTR, CDS and 3′UTR of mRNAs for peaks common to all samples. (F) Graphical representation of frequency of m6A peaks and methylation motifs in genes, divided into 5 distinct regions. (G) Distribution of m6A peaks across the length of mRNAs (n=5070) and non-coding RNAs (n=51). See also Figure S1D, S1E, S1F, S1G and S1H. (H) Scatter plot representation of m6A enrichment score (on the X axis) and gene expression level (on the Y axis) for each m6A peak. See also Figure S1I. (I) Box plot representing the half-life for transcripts with at least one modification site and transcripts with no modification site identified. See also figure S1J and S1K.
Figure 2
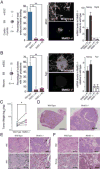
Figure 2. Characterization of Mettl3 knock out cells
(A) Western blot for Mettl3 and PARP in wild type and two cell lines with CRISPR induced loss of protein (DD: DNA damaging agent). Actin is used as loading control. See also Figure S2A. (B) m6A ratio determined by 2D-TLC in wild type and Mettl3 KO. Error bars represent standard deviation of 3 biological replicates in all panels. See also Figure S2B and S2C. (C) Alkaline phosphatase staining of wild type and Mettl3 knock out cells. See also Figure S2D and S2E. (D) Box plot representation of colony radius for wild type and Mettl3 mutant cells. Experiments were performed in triplicate, with at least 50 colonies measured for each replicate. (E) Nanog staining of colonies of wild type and two cell lines with CRISPR induced loss of protein. (F) Cell proliferation assay of wild type and two cell lines with CRISPR induced loss of Mettl3 protein. See also Figure S2F, S2G and S2H.
Figure 3
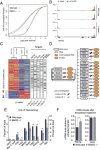
Figure 3. Mettl3 loss of function impairs ESC ability to differentiate
(A) Percentage of embryoid bodies with beating activity in Mettl3 KO and wild type control cells (right panel). Representative images of bodies stained for MHC and DAPI (center panel) and mRNA levels of Nanog and Myh6, measured by qRT-PCR, in Mettl3 KO cells in relation to wild type control cells. Error bars, standard deviation of 3 biological replicates in all panels. * represents p-value < 0.05, t-test (2 tailed). See also Movie S1 and S2. (B) Percentage of colonies with Tuj1 projections in Mettl3 KO and wild type control cells (right panel). Representative images of bodies stained for Tuj1 and DAPI (center panel) and mRNA levels of Nanog and Tuj1, measured by qRT-PCR, in Mettl3 KO cells in relation to wild type control cells. * represents p-value < 0.05, t-test (2 tailed). (C) Weight differences between teratomas generated from wild type and Mettl3 knock out cells. Tumors are paired by animal (n=5). (D) Representative sections of teratomas stained with hematoxylin and eosin at low magnification. Bar=1000 μm. See also Figure S3A. (E and F) Immunohistochemistry with antibody against Ki67 (E) and with antibody against Nanog (F). Bar represents 100 μm. See also Figure S3B.
Figure 4
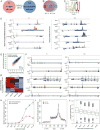
Figure 4. Impact of loss of Mettl3 on the mESC methylome
(A) Cumulative distribution function of log2 peak intensity of m6A modified sites. (B) Sequencing read density for input (grey) vs. in m6A IP (red) for Nanog. Y-axis represents normalized number of reads. Gene model as in Figure 1A. (C) Heatmap representing IP enrichment values for peaks with statistically significant difference between wild type and Mettl3 mutant. Bar to the right represent genes in each dataset with a >1.5 fold decrease in IP enrichment values. (D) Model of genes involved in maintenance of stem cell state (adapted from Young et al., 2011), representing transcripts with loss of m6A modification in Mettl3 −/− cells. (E) Percentage of input recovered after m6A IP measured by Nanostring for each mRNA. Error bars, standard deviation of 2 biological replicates. *, p-value < 0.05, t-test (2 tailed). (F) mRNA levels of Nanog and Oct4, measured by qRT-PCR, after PolII inhibition relative to untreated sample in wild type and Mettl3 KO cells. Error bars, standard deviation of 3 biological replicates. *, p-value < 0.05, t-test (2 tailed).
Figure 5
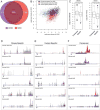
Figure 5. m6A-seq profiling of hESC during endoderm differentiation
(A) m6A-seq was performed in resting (undifferentiated) human H1-ESCs (T0) and after 48hrs of Activin A induction towards endoderm (mesoendoderm) (T48). (B) Venn diagram of the overlap between high-confidence T0 and T48 m6A peaks. The number of genes in each category is shown in parenthesis. See also Table S3 and S4. (C) Sequence motif identified after analysis of m6A enrichment regions. (D) UCSC Genome browser plots of m6A-seq reads along indicated RNAs. Grey reads are from non-immunoprecipitated control input libraries and red (T0) or blue (T48) reads are from anti-m6A immunoprecipitation libraries. Y-axis represents normalized number of reads; X-axis is genomic coordinates. Key regulators of stem cell maintenance (left) and master regulators of endoderm differentiation (right) are represented. See also Figure S4A. (E) Scatterplot of m6A peak intensities between two different time points (T0 versus T48) of the same biological replicate with only “high-confidence” T0 or T48 specific peaks supported by both biological replicates highlighted. (F) UCSC Genome browser plots of m6A-seq reads along indicated mRNAs in undifferentiated (T0) versus differentiated cells (T48). The grey reads are from non-immunoprecipitated control input libraries. The red and blue reads are from the anti-m6A RIP of T=0 and T=48 samples respectively. (G) Differential intensities of m6A peaks (DMPIs) identify hESC cell states T0 vs T48hrs. Z score scaled Log2 peak intensities of DMPIs are color-coded according to the legend. The peaks and samples are both clustered by average linkage hierarchical clustering using 1-Pearson correlation coefficient of log2 peak intensity as the distance metric. (H) Number of peaks per exon normalized by the number of motifs (on sense strand) in the exon. The error bars represent standard deviations from 1000 times of bootstrapping. (I) The normalized distribution of m6A peaks across the 5′UTR, CDS, and 3′UTR of mRNAs for T0 and T48 m6A peaks. See also Figure S4B, S4C and S4D. (J) Box plot representing the half-life for transcripts, with transcripts separated according to enrichment score. See also Figure S4E, S4F and S4G.
Figure 6
Figure 6. Evolutionary conservation and divergence of the m6A epi-transcriptomes of human and mouse ESCs
(A) Venn diagram showing a 62% overlap between methylated genes in M. musculus (purple) and H. sapiens (red) embryonic stem cells (p value= 3.5 × 10−92; Fisher exact test). See also Table S5 and S6. (B) The m6A peaks that could be mapped to orthologous genomic windows between mouse and human were identified. The intensities of m6A-seq signals in human and mouse ESCs were shown for m6A peaks found to be unique in mouse (blue), unique in human (red), and conserved between human and mouse (black). (C) Boxplot of peak intensities of m6A sites conserved (“common”) or not conserved (“specific”) in mouse and human ESCs. (p values=1.3×10⁻¹⁵ and 8.7×10⁻²³ respectively). (D to F) UCSC Genome browser plots of m6A-seq reads along indicated mRNAs. The grey reads are from non-immunoprecipitated control input libraries and the purple and red reads are from the anti-m6A RIP of mESCs and hESCs (T0) respectively. (D) Mouse-specific m6A modifications are represented. (E) Human-specific m6A modifications ESCs are represented. (F) Conserved m6A modifications at gene and site level are represented. Genes such CHD6 have a conserved m6A peak location at its 3′UTR as well as mouse and human specific m6A peaks at conserved but distinct exons.
Figure 7
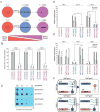
Figure 7. METTL3 is required for normal human ESC endoderm differentiation. Model of METTL3 function(s)
(A) hESC cells were transfected with anti-METTL3 shRNA (KD) as well control shRNA and stable hESC colonies were obtained after drug selection. Two independent clones were subjected to endodermal differentiation with Activin A and examined at various indicated time points. A schematic of the trends of gene expression for indicated markers of stem maintenance and endoderm differentiation is also shown. See also figure S5A. (B) Levels of METTL3 mRNA in hESC cells with control shRNA versus anti-METTL3 shRNA (KD) across the three indicated time points during endodermal differentiation (n=2 independent generated ES cell knockdown and control clones shown). In all panels, Error bars represent standard deviation across 3 replicates per time point; *, p value<0.05 t-test (2 tailed) between different clones. See also Figure S5B. (C) Anti-m6A dot blot was performed on 10x fold dilutions of polyA selected RNA from hESC cells derived from control shRNA versus anti-METTL3 shRNA clones. See also Figure S5C. (D and E) mRNA levels of endodermal and stem maintenance/marker genes. qRT-PCR was performed on indicated genes and time points (n=2 independently generated ES cell knockdown and control clones shown). See also Figure S5D. (F) Model: m6A marks transcripts for faster turn-over. Upon transition to new cell fate, m6A marked transcripts are readily removed to allow the expression of new gene expression networks. In the absence of m6A, the unwanted presence of transcripts will disturb the proper balanced required for cell fate transitions.

Comment in

Similar articles

Cited by

References

    1. Bodi Z, Zhong S, Mehra S, Song J, Graham N, Li H, May S, Fray RG. Adenosine Methylation in Arabidopsis mRNA is Associated with the 3′ End and Reduced Levels Cause Developmental Defects. Front Plant Sci. 2012;3:48. - PMC - PubMed
    1. Clancy MJ, Shambaugh ME, Timpte CS, Bokar JA. Induction of sporulation in Saccharomyces cerevisiae leads to the formation of N6-methyladenosine in mRNA: a potential mechanism for the activity of the IME4 gene. Nucleic Acids Res. 2002;30:4509–4518. - PMC - PubMed
    1. Dawlaty MM, Breiling A, Le T, Raddatz G, Barrasa MI, Cheng AW, Gao Q, Powell BE, Li Z, Xu M, et al. Combined deficiency of Tet1 and Tet2 causes epigenetic abnormalities but is compatible with postnatal development. Dev Cell. 2013;24:310–323. - PMC - PubMed
    1. Dawlaty MM, Ganz K, Powell BE, Hu YC, Markoulaki S, Cheng AW, Gao Q, Kim J, Choi SW, Page DC, et al. Tet1 is dispensable for maintaining pluripotency and its loss is compatible with embryonic and postnatal development. Cell Stem Cell. 2011;9:166–175. - PMC - PubMed
    1. Dominissini D, Moshitch-Moshkovitz S, Schwartz S, Salmon-Divon M, Ungar L, Osenberg S, Cesarkas K, Jacob-Hirsch J, Amariglio N, Kupiec M, et al. Topology of the human and mouse m6A RNA methylomes revealed by m6A-seq. Nature. 2012;485:201–206. - PubMed

Publication types

MeSH terms