. 2014 Nov 10;31(3):265-278.
doi: 10.1016/j.devcel.2014.09.004. Epub 2014 Oct 30.

The intraflagellar transport protein IFT27 promotes BBSome exit from cilia through the GTPase ARL6/BBS3

Affiliations

The intraflagellar transport protein IFT27 promotes BBSome exit from cilia through the GTPase ARL6/BBS3

Gerald M Liew et al. Dev Cell. .

Abstract

The sorting of signaling receptors into and out of cilia relies on the BBSome, a complex of Bardet-Biedl syndrome (BBS) proteins, and on the intraflagellar transport (IFT) machinery. GTP loading onto the Arf-like GTPase ARL6/BBS3 drives assembly of a membrane-apposed BBSome coat that promotes cargo entry into cilia, yet how and where ARL6 is activated remains elusive. Here, we show that the Rab-like GTPase IFT27/RABL4, a known component of IFT complex B, promotes the exit of BBSome and associated cargoes from cilia. Unbiased proteomics and biochemical reconstitution assays show that, upon disengagement from the rest of IFT-B, IFT27 directly interacts with the nucleotide-free form of ARL6. Furthermore, IFT27 prevents aggregation of nucleotide-free ARL6 in solution. Thus, we propose that IFT27 separates from IFT-B inside cilia to promote ARL6 activation, BBSome coat assembly, and subsequent ciliary exit, mirroring the process by which BBSome mediates cargo entry into cilia.


Conflict of interest statement

The authors declare no conflict of interest.

Figures

Figure 1
Figure 1. Identification of ARL6 as an interactor of IFT27
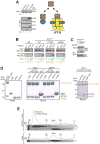
(A–C) Murine IMCD3 cells stably expressing human IFT27, IFT27[K68A] (“GTP-locked”), or IFT27[T19N] (“GDP-locked”) tagged at the C-terminus with a LAP tag (S tag followed by a HRV3C cleavage site and GFP) were stained for IFT88 (red), acetylated tubulin (white) and DNA (blue). IFT27LAP variants were visualized through the intrinsic fluorescence of GFP. (A) Inset shows the individual fluorescence channels vertically offset from one another by 3 pixels. A yellow arrowhead points to the base of a cilium in the GFP channel of IFT27[T19N]LAP cells. Scale bar: 5 μm (main panels), 1 μm (insets). (B–C) Magnified views of cilia from IFT27LAP cells (B) or IFT27[T19N]LAP cells (C). Scale bar: 1 μm. In (C) endogenous mouse IFT27 was knocked down leaving human IFT27[T19N]LAP as the major IFT27 protein in those cells. See Figure S1C for control siRNA experiment. (D) Lysates were subjected to anti-GFP antibody capture and HRV3C (control, IFT27LAP) or TEV (LAPIFT88) cleavage elution before SDS-PAGE and silver staining (top) or immunoblotting (bottom). Asterisks indicate proteases used for cleavage elution. In parallel, the eluates were analyzed by mass spectrometry and the spectral counts for each IFT-B subunit are shown in the table on the right. Spectral counts from LAPIFT88 are the aggregate of three separate mass spectrometry experiments. Immunoblotting for IFT-B subunits (IFT88, IFT57) and for ARL6 was conducted to confirm the mass spectrometry results. Immunoblotting for the S-tag that remains on IFT27LAP after HRV3C cleavage shows the amounts of all IFT27 variants recovered in the LAP eluates. See also Figure S1.
Figure 2
Figure 2. IFT27 directly interacts with nucleotide-empty ARL6
(A) LAP eluates from IFT27LAP and LAPIFT88 were analyzed by immunoblotting for IFT-B subunits (IFT88, IFT57), IFT27 and ARL6. Twice as much of the LAPIFT88 eluate was loaded compared to the IFT27LAP eluate. Note that the IFT27 antibody preferentially recognizes murine IFT27 over human IFT27, accounting for the lower signal intensity of IFT27S-tag in the IFT27LAP lane compared to that of murine IFT27 in the LAPIFT88 lane. (B) Co-transfections/co-immunoprecipitations were performed with all combinations of “GTP-locked” or “GDP-locked” variants of ARL6 and IFT27. IFT25 was co-transfected with IFT27LAP to ensure IFT27 stability. (C) IFT25/IFT27LAP-decorated beads were used to capture overexpressed MycARL6 out of HEK cell lysate in the presence or absence of EDTA. (D) The IFT25/IFT27-GST complex, GST, ARL6 and SAR1A were expressed in bacteria and purified to near-homogeneity before SDS-PAGE and Coomassie staining (left panel). IFT25/IFT27-GST was mixed with ARL6 or SAR1A in the presence of various nucleotides and complexes were recovered on Glutathione Sepharose beads before LDS elution, SDS-PAGE and Coomassie staining (middle panel). In a similar experiment, IFT25/IFT27-GST was mixed with ARL6 in the presence of GTPγS, EDTA or GDP/AlF4 (right panel). (E) ARL6, either alone or mixed with the IFT25/IFT27 complex and EDTA was resolved by size exclusion chromatography (Superdex 200). Size markers: 66.9 kDa (Thyroglobulin), 35.0 kDa (β-lactoglobulin) and 6.5 kDa (Aprotinin). See also Figure S2.
Figure 3
Figure 3. IFT27 stabilizes the nucleotide-empty form of ARL6
(A) Time course of [3H]-GDP release from ARL6 in the presence or absence of IFT25/IFT27. Data points were fit to a single exponential decay equation and plotted. See Figure S3A for a summary of all conditions tested. (B–D) EDTA-induced ARL6 precipitation at 37°C was followed by light diffraction at 350 nm. (B) Rescue of ARL6 precipitation by stoichiometric concentrations of IFT25/ IFT27-GST. (C) Effect of different IFT25/IFT27 variants on the rescue of EDTA-induced ARL6 precipitation. Judging by endpoint absorbance values, IFT25/GST-IFT27 (N-terminal GST tag) was ~6 times more efficient than IFT25/IFT27-GST (C-terminal GST tag) in rescuing EDTA-induced Arl6 precipitation. Addition of IFT25 (even at 10-fold molar excess over ARL6) does not rescue precipitation of nucleotide empty ARL6. (D) Model for IFT27 stabilization of nucleotide-empty ARL6. See also Figure S3.
Figure 4
Figure 4. Loss of IFT27 causes hyperaccumulation of ARL6 and BBSome in cilia
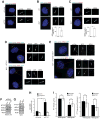
(A) IMCD3 cells were treated with control siRNA or IFT27 siRNA and immunostained for the BBSome subunit BBS5. (B, C) WT and Ift27−/− MEFs were immunostained for ARL6 (B) or BBS5 (C). At least 100 cilia per experiment were counted, and the percentages of ARL6- and BBS5-positive cilia were plotted. Error bars represent standard deviations (SDs) between three independent experiments. The asterisks denote that a significant difference was found by unpaired t-test between WT and Ift27−/− MEFs for ARL6 accumulation (p = 0.0176) and BBS5 accumulation (p = 0.00143). (D) IFT27LAP and (E) IFT27[T19N]LAP were transfected into Ift27−/− MEFs to rescue the ciliary accumulation of ARL6 and BBSome. (See also Figure S3C for rescue by transfection of IFT27[K68A]LAP). Scale bars: 5 μm (cell panels), 1 μm (cilia panels). (F–G) Whole cell lysates from control siRNA- and IFT27 siRNA-treated IMCD3 cells (F) or WT and Ift27−/− MEFs (G) were immunoblotted for IFT27, ARL6, BBSome and Actin. (H) Ciliary and cytoplasmic NG3-BBS1 fluorescent intensities were measured in control siRNA- and IFT27 siRNA-treated IMCD3-[NG3-BBS1] cells. Data were collected from 17 to 18 cells for each condition in five independent experiments. Error bars represent +/− SD. N.S.: p>0.05; *: p<0.05. (I) Bar graphs representing the velocity (left) and frequency (right) of NG3-IFT88 fluorescent foci movement in cilia from control siRNA- and IFT27 siRNA-treated IMCD3-[NG3-IFT88] cells. More than 200 tracks of IFT88 foci were analyzed for each treatment. N.S.: p>0.05. See also Figure S4.
Figure 5
Figure 5. IFT27 is required for rapid exit of BBSome from cilia
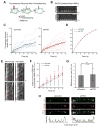
(A) Schematic of Fluorescence Loss After Photobleaching (FLAP) assay. NG3-BBS1 was photobleached in the cytoplasm by intense illuminations with a 488 nm laser. The bleached areas of the cell are distant from the cilium to ensure that ciliary NG3-BBS1 is not bleached by the illuminations. The subsequent loss of NG3-BBS1 fluorescence from cilia was monitored by live imaging. (B) Time series montage representing the dynamic loss of ciliary NG3-BBS1 fluorescence in FLAP assay. Ciliary tip and base are marked. Scale bar, 5 μm. (C) Decay of ciliary NG3-BBS1 fluorescence signal in FLAP assays for control siRNA- and IFT27 siRNA-treated cells. The fluorescence decay was measured for individual cilia, and plotted as a smoothed line for siControl (left, blue lines) and siIFT27 (right, red lines) treated cells. Photobleaching was negligible (<2%, data not shown). Each experiment was individually fit to a single exponential, and a simulation describing the average of these fits is shown as a bold line. Data were collected from five independent experiments (number of cilia analyzed n=17 for siControl and n=18 for siIFT27). (D and E) The exit of BBSome from cilia is slower in the absence of IFT27. (D) Replotting of the simulations describing the average fits from panel (B) for siControl (blue solid line) and siIFT27 (red dotted line) treated cells. (E) Average half-lives (t1/2) for ciliary exit of NG3-BBSome. For siControl, t1/2 =136s +/− 20s, and for siIFT27, t1/2 =349s +/− 20s. The asterisk indicates a highly significant difference in exit rates (unpaired t-test, p < 5 × 10⁻⁶). Error bars represent +/− 1 SD.
Figure 6
Figure 6. IFT27 does not affect the entry of BBSome into cilia
(A) Schematic of Fluorescence Recovery After Photobleaching (FRAP) assay. Ciliary NG3-BBS1 was photobleached by intense illumination with a 488 nm laser. The subsequent ciliary NG3-BBS1 fluorescence recovery from cytoplasmic pools was monitored by live imaging. (B) Time series montage representing the dynamic recovery of ciliary NG3-BBS1 fluorescence in FRAP assay. Ciliary tip and base are marked. Scale bar, 5 μm. (C–D) Recovery of NG3-BBS1 ciliary fluorescence in FRAP assays for control siRNA- and IFT27 siRNA-treated cells.. (C) The fluorescent intensity was measured for each individual cilia, and plotted as a smoothed line for siControl (left, blue lines) and siIFT27 (right, red lines) treated cells. The averaged fluorescence values at each time points are shown in the plot (blue dots for siControl and red dots for siIFT27). Photobleaching was measured and corrected (see Experimental Procedures). (D) Single exponential fit to the averaged fluorescence recovery for siControl (blue dashed line) or siIFT27 (red dashed line). (E) Simultaneous imaging of tagRFP.T-IFT88 (left) and NG3-BBS1 (right) movements in cilia of IMCD3 cells. The fluorescent foci tracks for IFT88 (red) and NG3-BBS1 (green) are indicated in the bottom panels. Scale bar, 2 μm. (F and G) Initial velocities for BBSome entry into cilia of Control siRNA and IFT27 siRNA-treated cells. (E) Time points from the first 30 second of the siControl and siIFT27 experiments in (C) were averaged and plotted. (F) The slopes from the curves in (E), corresponding to the initial velocities of BBSome entry into cilia, were plotted in a bar graph. There was no significant difference for the velocities of BBSome entry (unpaired t-test, p = 0.79). For panels (E) and (F), error bars represent +/− 1 SD. (H) Ciliated IMCD3 cells expressing NG3-BBS1 were immunostained for IFT88 and imaged by Structured Illumination Microscopy (SIM) on an OMX Blaze (API). Colocalization between IFT88 (red) and NG3-BBS1 (green) is displayed on a line profile (bottom). While each foci of BBS1 precisely co-localizes with an IFT88 spot in cilia of Control siRNA-treated cells, the majority of BBS1 foci are free of IFT88 (arrowheads) in cilia of IFT27 siRNA-treated cells (bottom right). Scale bar, 1 μm. See also Figure S5.
Figure 7
Figure 7. IFT27 and ARL6 are required for ciliary exit of GPR161
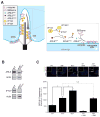
(A) A model for the turnaround point. GTP hydrolysis on ARL6 leads to disassembly of BBSome coats at the tip. IFT-B particles release IFT25/IFT27 by an unknown mechanism upon IFT train disassembly at the tip. Free IFT27 then participates in GDP to GTP exchange on ARL6 and assembly of a BBSome coat laden with cargoes and attached to a retrograde IFT train ensues. (B) Genome engineering of IMCD3 WT, Arl6−/− or Ift27−/− cells. Knockout of the respective gene products are demonstrated by immunoblotting for ARL6 and IFT27. As a loading control, lysates were immunoblotted for Actin. (C) IMCD3 WT, Arl6−/− or Ift27−/− cells treated with SAG or vehicle or untreated were stained for GPR161 (green), acetylated tubulin (red) and DNA (blue). Scale bar, 4 μm. Background-subtracted integrated ciliary fluorescence intensities were measured from 42 to 76 cilia in 5 to 6 microscopic fields for each condition and plotted in the bar chart (bottom). *: p < 0.05, N.S.: p > 0.05, Error bars represent +/− SEM.

Comment in

Similar articles

Cited by

References

    1. Aldahmesh MA, Li Y, Alhashem A, Anazi S, Alkuraya H, Hashem M, Awaji AA, Sogaty S, Alkharashi A, Alzahrani S, et al. IFT27, encoding a small GTPase component of IFT particles, is mutated in a consanguineous family with Bardet-Biedl syndrome. Hum Mol Genet. 2014;23:3307–3315. - PMC - PubMed
    1. Berbari NF, Lewis JS, Bishop GA, Askwith CC, Mykytyn K. Bardet-Biedl syndrome proteins are required for the localization of G protein-coupled receptors to primary cilia. Proc Natl Acad Sci USA. 2008;105:4242–4246. - PMC - PubMed
    1. Bhogaraju S, Taschner M, Morawetz M, Basquin C, Lorentzen E. Crystal structure of the intraflagellar transport complex 25/27. EMBO J. 2011;30:1907–1918. - PMC - PubMed
    1. Breslow DK, Koslover EF, Seydel F, Spakowitz AJ, Nachury MV. An in vitro assay for entry into cilia reveals unique properties of the soluble diffusion barrier. J Cell Biol. 2013;203:129–147. - PMC - PubMed
    1. Cheeseman IM, Desai A. A combined approach for the localization and tandem affinity purification of protein complexes from metazoans. Sci STKE. 2005;2005:pl1. - PubMed

Publication types

Substances