. 2014 Nov 12:8:127.
doi: 10.3389/fnana.2014.00127. eCollection 2014.

All brains are made of this: a fundamental building block of brain matter with matching neuronal and glial masses

Affiliations

All brains are made of this: a fundamental building block of brain matter with matching neuronal and glial masses

Bruno Mota et al. Front Neuroanat. .

Abstract

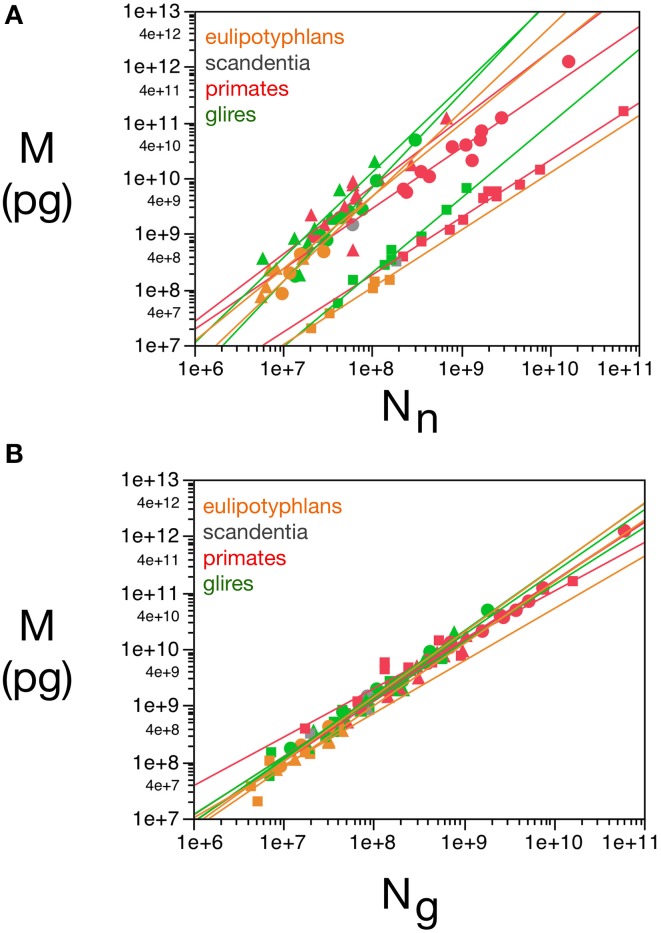
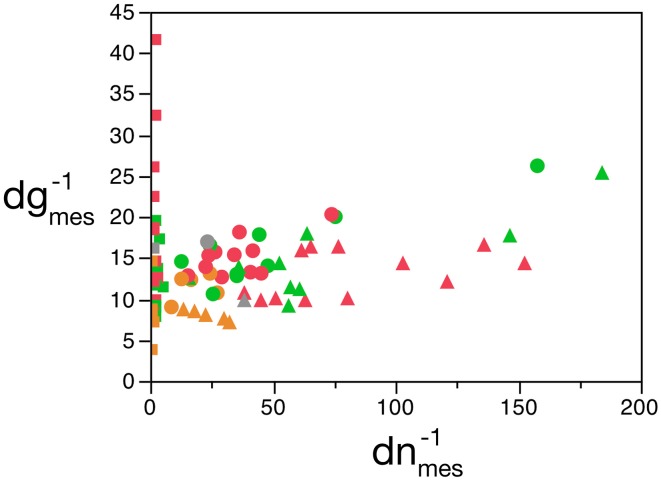
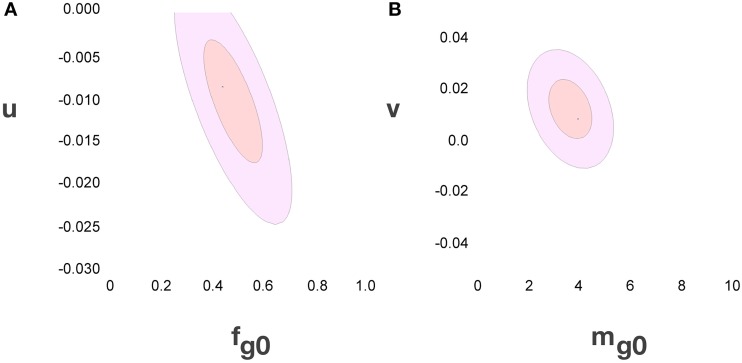
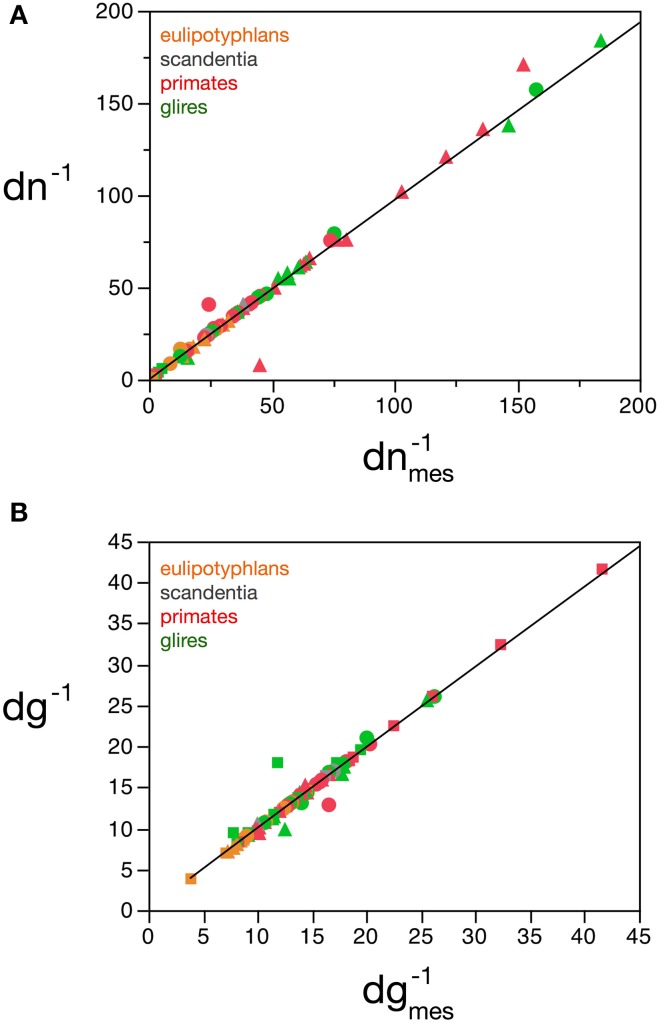
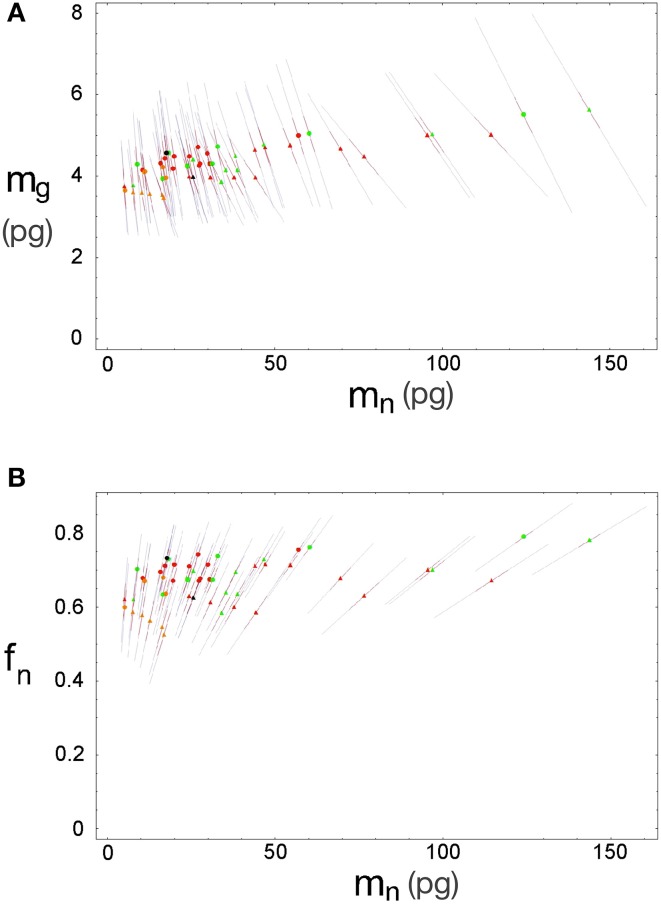
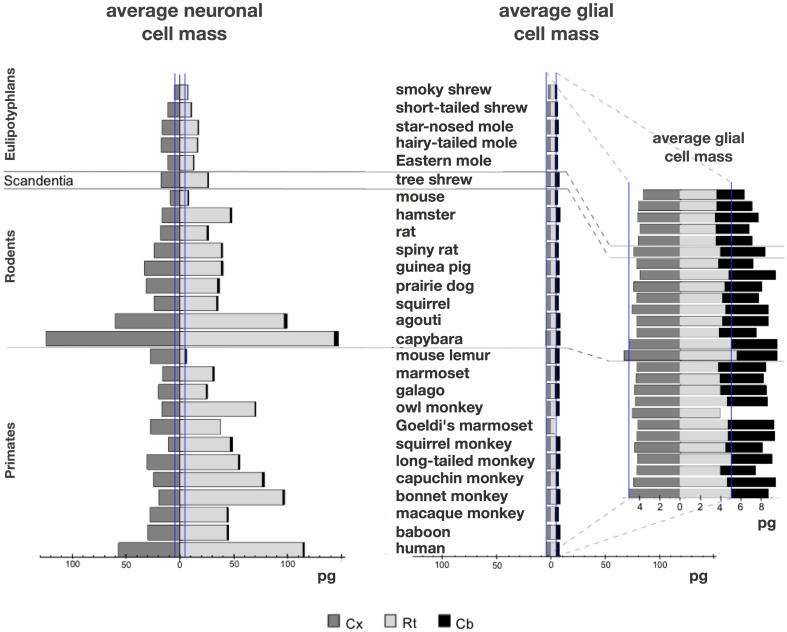
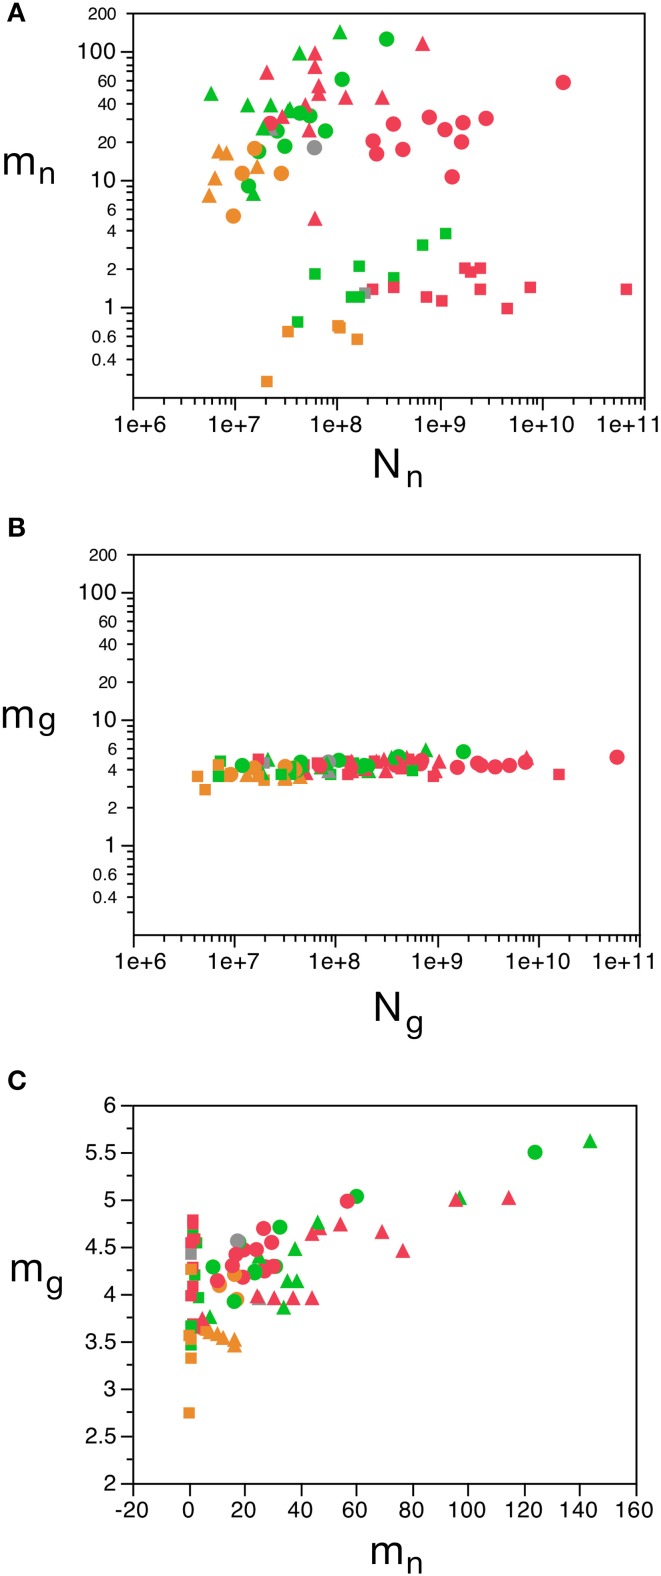
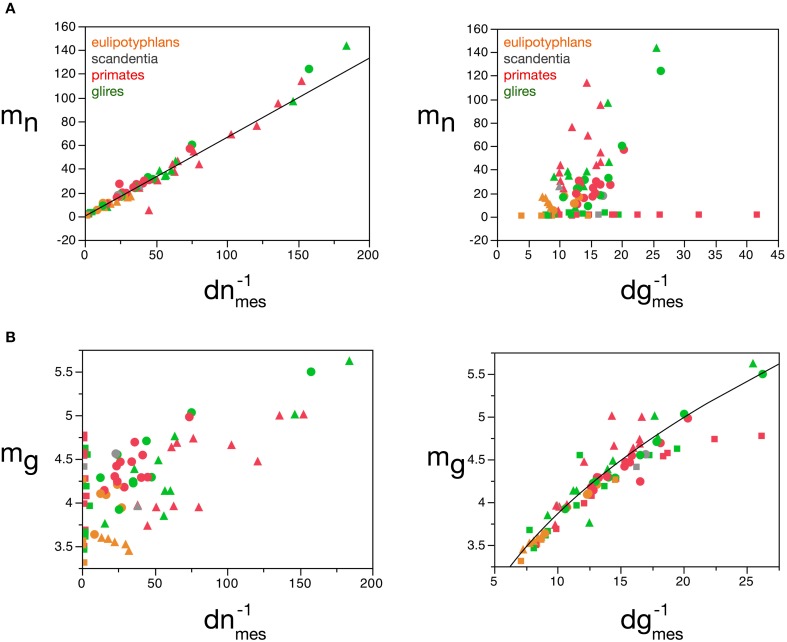
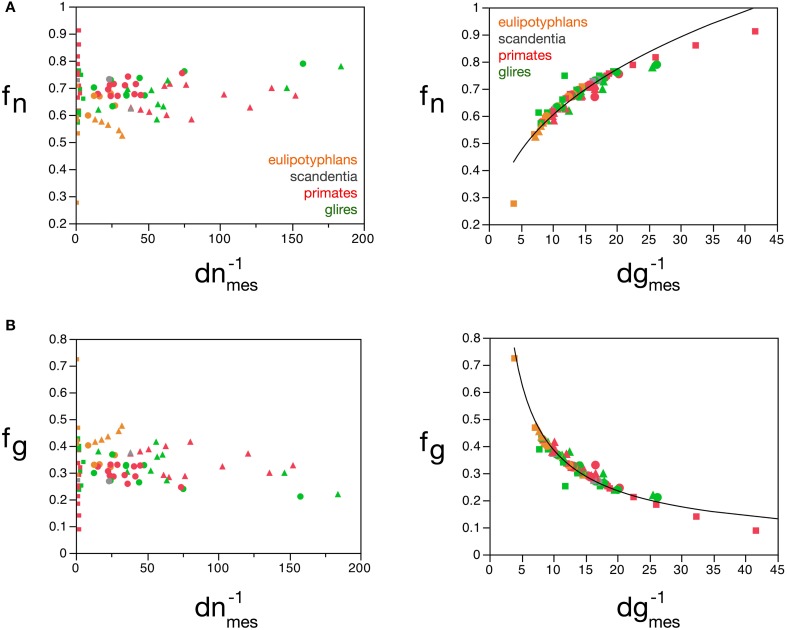
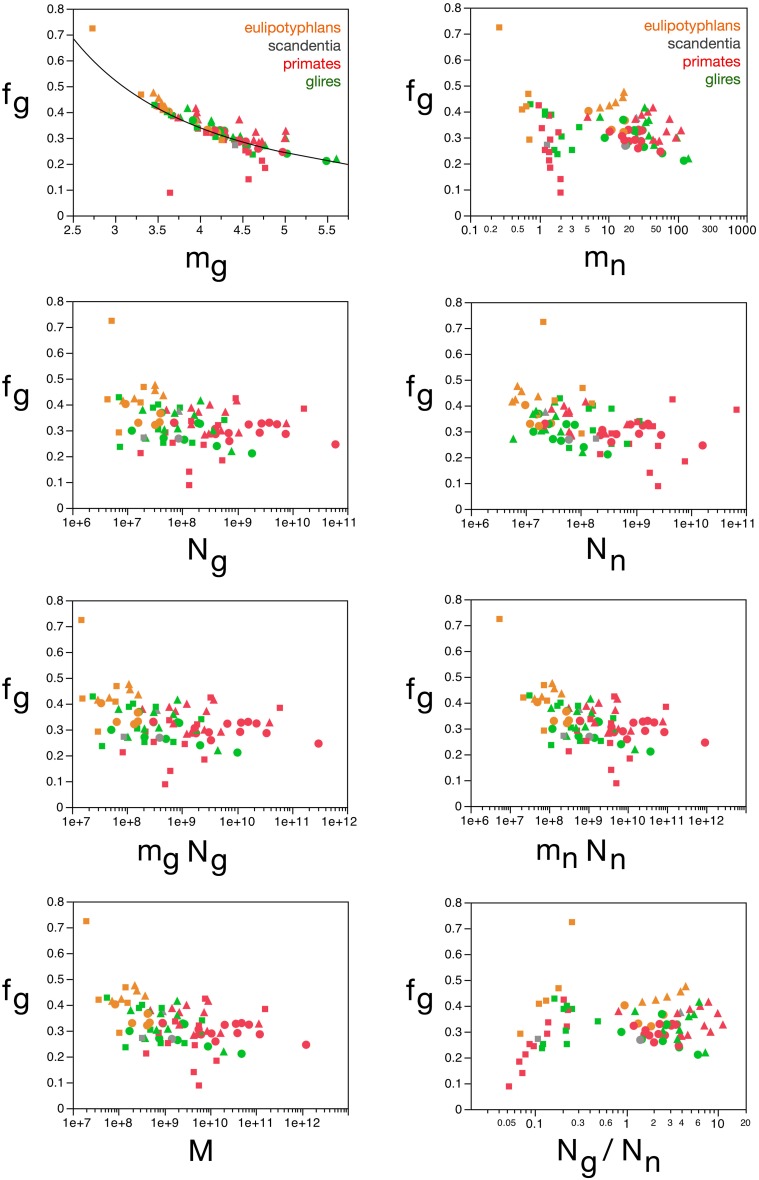
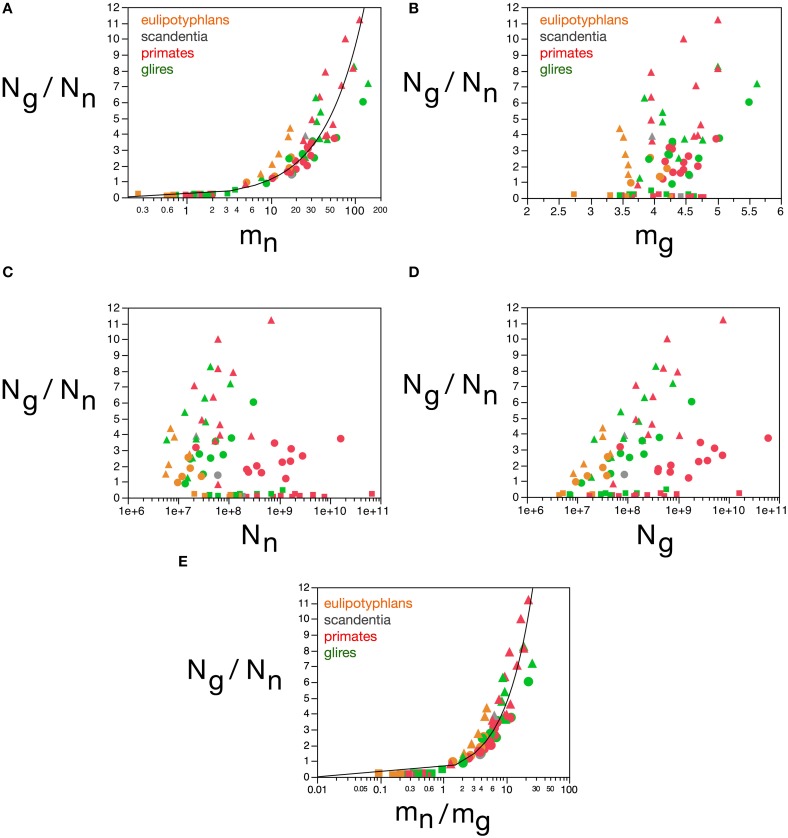
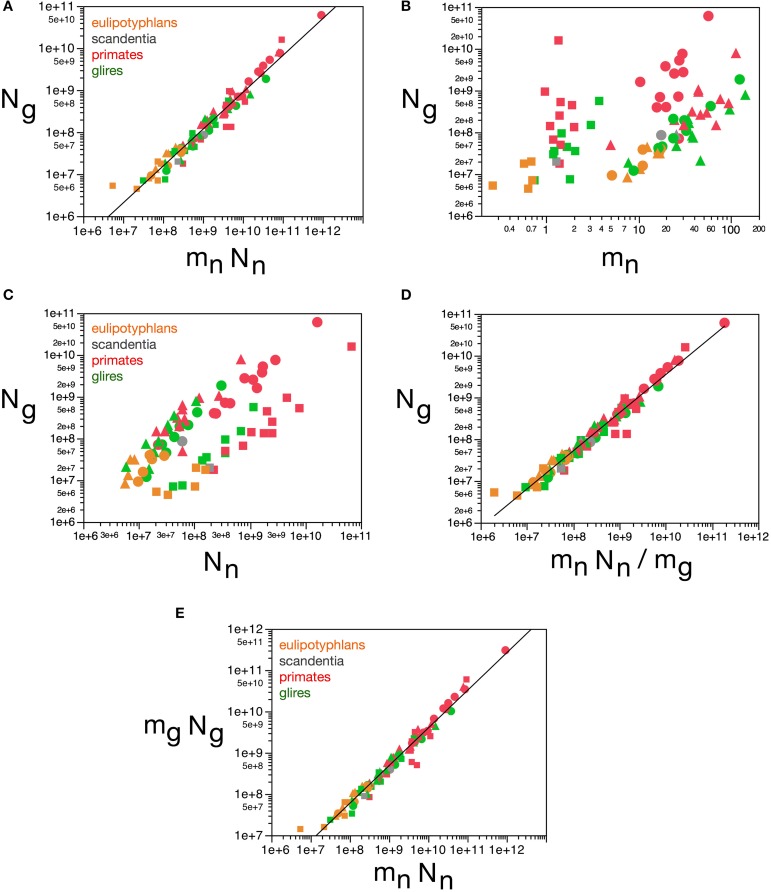
How does the size of the glial and neuronal cells that compose brain tissue vary across brain structures and species? Our previous studies indicate that average neuronal size is highly variable, while average glial cell size is more constant. Measuring whole cell sizes in vivo, however, is a daunting task. Here we use chi-square minimization of the relationship between measured neuronal and glial cell densities in the cerebral cortex, cerebellum, and rest of brain in 27 mammalian species to model neuronal and glial cell mass, as well as the neuronal mass fraction of the tissue (the fraction of tissue mass composed by neurons). Our model shows that while average neuronal cell mass varies by over 500-fold across brain structures and species, average glial cell mass varies only 1.4-fold. Neuronal mass fraction varies typically between 0.6 and 0.8 in all structures. Remarkably, we show that two fundamental, universal relationships apply across all brain structures and species: (1) the glia/neuron ratio varies with the total neuronal mass in the tissue (which in turn depends on variations in average neuronal cell mass), and (2) the neuronal mass per glial cell, and with it the neuronal mass fraction and neuron/glia mass ratio, varies with average glial cell mass in the tissue. We propose that there is a fundamental building block of brain tissue: the glial mass that accompanies a unit of neuronal mass. We argue that the scaling of this glial mass is a consequence of a universal mechanism whereby numbers of glial cells are added to the neuronal parenchyma during development, irrespective of whether the neurons composing it are large or small, but depending on the average mass of the glial cells being added. We also show how evolutionary variations in neuronal cell mass, glial cell mass and number of neurons suffice to determine the most basic characteristics of brain structures, such as mass, glia/neuron ratio, neuron/glia mass ratio, and cell densities.

Keywords: allometry; brain size; cell size; glia/neuron ratio; number of glial cells; number of neurons.


Figures

Figure 1
Figure 1
Variation in structure mass as a function of number of neurons and glial cells in the structure. Average brain structure mass for each species is plotted as a function of its total number of neurons (A) and non-neuronal (glial) cells (B). Structure mass is given in picograms. Power functions are plotted separately for cerebral cortex (circles), cerebellum (squares) and rest of brain (triangles) in eulipotyphlans (orange), primates (red) and rodents (green). Power function constants and exponents are listed in Table 1. The two graphs are plotted with identical scales for comparison. Notice that the power functions are overlapping in (B), but not in (A). Data from Herculano-Houzel et al. (2006, 2007, 2011), Azevedo et al. (2009), Sarko et al. (2009), and Gabi et al. (2010).
Figure 2
Figure 2
Covariation in glial and neuronal density across brain structures and species. The inverse of neuronal (X-axis) and glial (Y-axis) cell density, expressed as picograms per cell, is plotted for each species and brain structure: cerebral cortex (circles), cerebellum (squares) and rest of brain (triangles). Data from Herculano-Houzel et al. (2006, 2007, 2011), Azevedo et al. (2009), Sarko et al. (2009), and Gabi et al. (2010).
Figure 3
Figure 3
Uncertainty ellipses for parameters in the model. (A) Estimates for u and fg0. (B) Estimates for v and mg0. The values that minimize the χ2 function are u = −0.010 ± 0.005 pg−1, v = 0.017 ± 0.009, fg0 = 0.48 ± 0.08 and mg0 = 3.6 ± 0.8 pg.
Figure 4
Figure 4
Correspondence between measured and estimated cell densities. (A) Graphs show the correspondence between measured and estimated values for the inverse of neuronal density estimated by the model, dn−1, and the inverse of measured neuronal density, d−1nmes. (B) Correspondence between measured and estimated values for the inverse of glial density estimated by the model, d−1g, and the inverse of measured glial density, d−1gmes. Values expressed as picograms per cell, plotted for each species and brain structure: cerebral cortex (circles), cerebellum (squares) and rest of brain (triangles). Power fits plotted have exponents 0.991 ± 0.015, r2 = 0.983, p < 0.0001 (A) and 0.987 ± 0.021, r2 = 0.967, p < 0.0001 (B). Data from Herculano-Houzel et al. (2006, 2007, 2011), Azevedo et al. (2009), Sarko et al. (2009), and Gabi et al. (2010).
Figure 5
Figure 5
Errors for estimated neuronal and glial cell masses and neuronal mass fraction. Each point indicates the estimated average neuronal cell mass, mn, and average glial cell mass, mg (A) or neuronal mass fraction, fn (B) for a given brain structure in a species: cerebral cortex (circles), cerebellum (squares) and rest of brain (triangles) in eulipotyphlans (orange), primates (red) and rodents (green). Errors are shown as bars ranging from each point.
Figure 6
Figure 6
Large variation in average neuronal cell mass, but not in average glial cell mass. Main figure, horizontal bars (stacked, non-overlapping) indicate estimated average neuronal (left) and glial (right) cell mass in the cerebral cortex (dark gray), cerebellum (black) and rest of brain (light gray) for each species. Neuronal and glial cell masses are shown on same scale for comparison. Inset, estimated average glial cell masses shown on a larger scale. Values per structure and species are given in Table 5.
Figure 7
Figure 7
Variation in predicted average neuronal and glial cell mass as a function of number of neurons and glial cells in the structure. (A) Estimated average neuronal cell mass (mn) for each brain structure in each species is plotted as a function of the total number of neurons in the structure (Nn). (B) Estimated average glial cell mass (mg) for each brain structure in each species is plotted as a function of the total number of glial cells in the structure (Ng). (C) Estimated average glial cell mass plotted as a function of estimated average neuronal cell mass in each brain structure and species. Cell mass given in picograms. Cerebral cortex plotted as circles, cerebellum as squares, and rest of brain as triangles; eulipotyphlans shown in orange, primates in red, and rodents in green. Graphs in (A,B) are plotted with identical scales for comparison, to illustrate the large variation in mn but small variation in mg. Data from Herculano-Houzel et al. (2006); Herculano-Houzel et al. (2007); Herculano-Houzel et al. (2011), Azevedo et al. (2009), Sarko et al. (2009), and Gabi et al. (2010).
Figure 8
Figure 8
Average neuronal and glial cell mass is well predicted by measured neuronal and glial cell densities, respectively. (A) Estimated average neuronal cell mass (mn) for each brain structure in each species is plotted as a function of the inverse of the measured neuronal density in the structure (d−1nmes, left) and as a function of the inverse of the measured glial density in the structure (d−1gmes, right). (B) Estimated average glial cell mass (mg) for each brain structure in each species is plotted as a function of the inverse of the measured neuronal density in the structure (d−1nmes, left) and as a function of the inverse of the measured glial density in the structure (d−1gmes, right). Cell mass given in picograms, and the inverse of cell densities in picogram/neuron. Functions plotted are (A) mn = 0.649 (d−1nmes)1.004 ± 0.019 (r2 = 0.973, p < 0.0001) and (B) mg = 1.648 (d−1gmes)0.370 ± 0.017 (r2 = 0.897, p < 0.0001). Cerebral cortex plotted as circles, cerebellum as squares, and rest of brain as triangles; eulipotyphlans shown in orange, primates in red, and rodents in green. Data from Herculano-Houzel et al. (2006, 2007, 2011), Azevedo et al. (2009), Sarko et al. (2009). and Gabi et al. (2010).
Figure 9
Figure 9
Neuronal and glial mass fractions are well predicted by measured glial cell density. (A) Estimated neuronal mass fraction (fn) in each brain structure in each species is plotted as a function of the inverse of the measured neuronal density in the structure (d−1nmes, left) and as a function of the inverse of the measured glial density in the structure (d−1gmes, right). (B) Estimated glial mass fraction (fg) in each brain structure in each species is plotted as a function of the inverse of the measured neuronal density in the structure (d−1nmes, left) and as a function of the inverse of the measured glial density in the structure (d−1gmes, right). Notice that neuronal (or glial) mass fraction is well predicted by variations in glial cell density, but not in neuronal cell density. Inverse of cell densities given in picograms/neuron. Functions plotted are (A) fn = 0.265 (d−1gmes)0.356 ± 0.019 (r2 = 0.823, p < 0.0001) and (B) fg = 2.008 (d−1gmes)−0.716 ± 0.026 (r2 = 0.906, p < 0.0001). Cerebral cortex plotted as circles, cerebellum as squares, and rest of brain as triangles; eulipotyphlans shown in orange, primates in red, and rodents in green. Data from Herculano-Houzel et al. (2006, 2007, 2011), Azevedo et al. (2009), Sarko et al. (2009), and Gabi et al. (2010).
Figure 10
Figure 10
Glial mass fraction varies with estimated average glial cell mass. Graphs show the estimated glial mass fraction (fg) in each brain structure in each species plotted as a function of estimated average glial cell mass (mg), estimated average neuronal cell mass (mn), number of glial cells in the structure (Ng), number of neurons in the structure (Nn), total glial mass in the structure (mgNg), total neuronal mass in the structure (mnNn), total mass of the structure (M), and glia/neuron ratio in the structure (Ng/Nn). Notice that neuronal (or glial) mass fraction is only well predicted by variations in estimated average glial cell mass. All masses in picograms. Cerebral cortex plotted as circles, cerebellum as squares, and rest of brain as triangles; eulipotyphlans shown in orange, primates in red, and rodents in green. Data from Herculano-Houzel et al. (2006, 2007, 2011), Azevedo et al. (2009), Sarko et al. (2009), and Gabi et al. (2010).
Figure 11
Figure 11
Glia/neuron ratio is best predicted by average neuronal cell mass and by the ratio between average neuronal and glial cell masses. Graphs show the glia/neuron ratio (Ng/Nn) in each brain structure in each species plotted (A) as a function of estimated average neuronal cell mass (mn), (B) as a function of estimated average glial cell mass (mg), (C) as a function of number of neurons in the structure (Nn), (D) as a function of number of glial cells in the structure (Ng), and (E) as a function of the ratio between average neuronal and average glial cell mass in the structure (mn/mg). Notice that glia/neuron ratio is only well predicted by variations in estimated average neuronal cell mass (A) and, even better, by the ratio between average neuronal and average glial cell mass in the structure. All masses in picograms. Functions plotted are (A) Ng/Nn = 0.137(mn)0.922 ± 0.035 (r2 = 0.898, p < 0.0001) and (E) Ng/Nn = 0.487(mn/mg)0.977 ± 0.030 (r2 = 0.929, p < 0.0001). Cerebral cortex plotted as circles, cerebellum as squares, and rest of brain as triangles; eulipotyphlans shown in orange, primates in red, and rodents in green. Data from Herculano-Houzel et al. (2006, 2007, 2011), Azevedo et al. (2009), Sarko et al. (2009), and Gabi et al. (2010).
Figure 12
Figure 12
Glial cell mass scales to match neuronal cell mass across brain structures and species. Graphs show numbers of glial cells (Ng) in each brain structure in each species plotted (A) as a function of total neuronal mass (mnNn), (B) as a function of estimated average neuronal cell mass (mn), (C) as a function of number of neurons in the structure (Nn), (D) as a function of the neuronal mass per glial cell in the structure (mnNn/mg). (E) Total glial mass in each structure (mgNg) varies as a function of total neuronal mass in the structure (mnNn). Notice that numbers of glial cells in brain structures are well predicted by variations in total neuronal mass in the structure (A) and by the average neuronal mass per glial cell (D). All masses in picograms. Functions plotted are (A) Ng = 1.491 mn.Nn0.877 ± 0.022 (r2 = 0.952, p < 0.0001), (D) mn.Nn/mg, with Ng = 2.603 (mn.Nn/mg)0.913 ± 0.020 (r2 = 0.965, p < 0.0001), and (E) Mg = 3.078 Mn0.911 ± 0.019 (r2 = 0.968, p < 0.0001). Cerebral cortex plotted as circles, cerebellum as squares, and rest of brain as triangles; eulipotyphlans shown in orange, primates in red, and rodents in green. Data from Herculano-Houzel et al. (2006, 2007, 2011), Azevedo et al. (2009), Sarko et al. (2009), and Gabi et al. (2010).
Figure 13
Figure 13
Neuron/glia mass ratio varies with average glial cell mass across brain structures and species. Graphs show the neuron/glia mass ratio (mnNn/mgNg) as (A) a function of estimated glial cell mass (mg) and (B) a function of the inverse of measured glial cell density (d−1gmes) in each brain structure in each species. Average glial cell mass in picograms; d−1gmes in picograms/neuron. Functions plotted are (A) mn.Nn/mg.Ng = 0.064 mg2.433 ± 0.260 (r2 = 0.528, p < 0.0001) and (B) mn.Nn/mg.Ng = 0.132 dgmes−11.072 ± 0.034 (r2 = 0.926, p < 0.0001). Cerebral cortex plotted as circles, cerebellum as squares, and rest of brain as triangles; eulipotyphlans shown in orange, primates in red, and rodents in green. Data from Herculano-Houzel et al. (2006, 2007, 2011), Azevedo et al. (2009), Sarko et al. (2009), and Gabi et al. (2010).
Figure 14
Figure 14
Neuronal mass per glial cell varies with average glial cell mass across brain structures and species. Graphs show the average neuronal mass per glial cell (mnNn/Ng) as (A) a function of estimated glial cell mass (mg) and (B) a function of the inverse of measured glial cell density (d−1gmes) in each brain structure in each species. Average glial cell mass in picograms; d−1gmes in picograms/neuron. Functions plotted are (a) Nn.mn/Ng = 0.064 mg3.433 ± 0.260 (r2 = 0.691, p < 0.0001) and (B) mn.Nn/Ng = 0.275 d−1gmes1.343 ± 0.033 (r2 = 0.954, p < 0.0001). Cerebral cortex plotted as circles, cerebellum as squares, and rest of brain as triangles; eulipotyphlans shown in orange, primates in red, and rodents in green. Data from Herculano-Houzel et al. (2006, 2007, 2011), Azevedo et al. (2009), Sarko et al. (2009), and Gabi et al. (2010).
Figure 15
Figure 15
Evo-devo model of brain tissue construction. Independent variables are average neuronal cell mass (mn), average glial cell mass (mg) and number of neurons (Nn). The product mn.Nn is the total neuronal mass in the tissue, which is then invaded by a number of glial cells Ng that depends on small variations in mg to create a total glial mass that matches the total neuronal mass in the tissue, depending on the ratio of neuronal cell mass per glial cell that we propose to be determined by mg. This results in a certain neuronal mass fraction, fn, and corresponding glial mass fraction, fg. In evolution, variations in Nn, linked or not to variations in mn, would yield structures of different masses whose glia/neuron ratios depend on mn and its ratio to mg. Additionally, smaller variations in mg lead to variations in the glial mass fraction, fg, and in the neuron/glial mass ratio.

Similar articles

Cited by

References

    1. Azevedo F. A. C., Carvalho L. R. B., Grinberg L. T., Farfel J. M., Ferretti R. E. L., Leite R. E. P., et al. . (2009). Equal numbers of neuronal and non-neuronal cells make the human brain an isometrically scaled-up primate brain. J. Comp. Neurol. 513, 532–541. 10.1002/cne.21974 - DOI - PubMed
    1. Bahney J., von Bartheld C. S. (2014). Calibration of the isotropic fractionator: comparison with unbiased stereology and DNA extraction for quantification of glial cells. J. Neurosci. Methods 222, 165–174. 10.1016/j.jneumeth.2013.11.002 - DOI - PMC - PubMed
    1. Bandeira F. C., Lent R., Herculano-Houzel S. (2009). Changing numbers of neuronal and non-neuronal cells underlie postnatal brain growth in the rat. Proc. Natl. Acad. Sci. U.S.A. 106, 14108–14113. 10.1073/pnas.0804650106 - DOI - PMC - PubMed
    1. Barres B. A. (2008). The mystery and magic of glia: a perspective on their roles in health and disease. Neuron 60, 430–440. 10.1016/j.neuron.2008.10.013 - DOI - PubMed
    1. Braitenberg V., Schüz A. (1998). Cortex: Statistic and Geometry of Neuronal Connectivity, 2nd Edn. New York, NY: Springer-Verlag.

LinkOut - more resources