. 2015 Jan 1;517(7532):33-8.
doi: 10.1038/nature14010. Epub 2014 Nov 19.

RNA regulons in Hox 5' UTRs confer ribosome specificity to gene regulation

Affiliations

RNA regulons in Hox 5' UTRs confer ribosome specificity to gene regulation

Shifeng Xue et al. Nature. .

Abstract

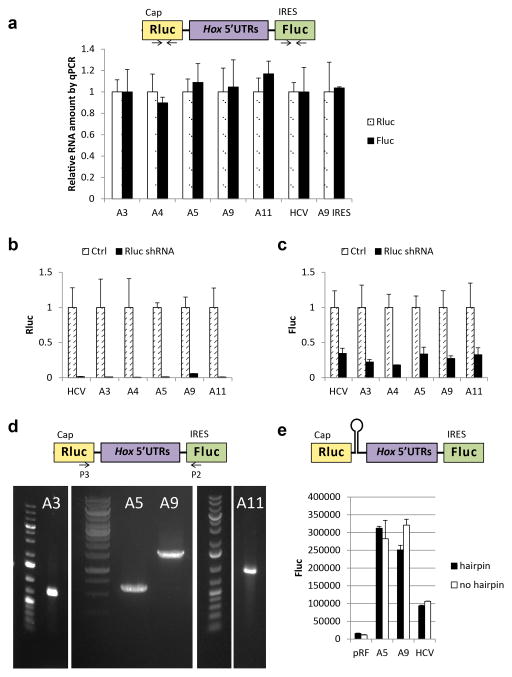
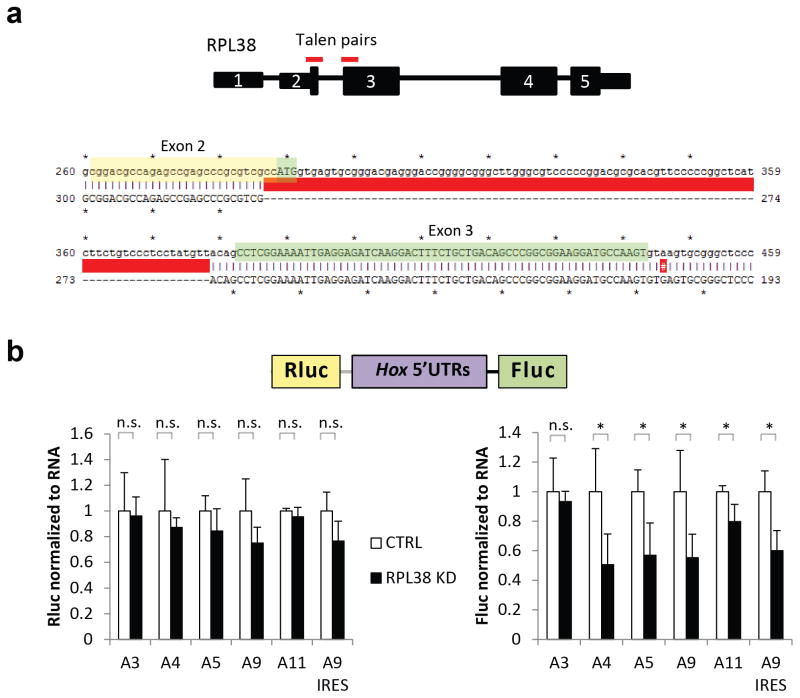
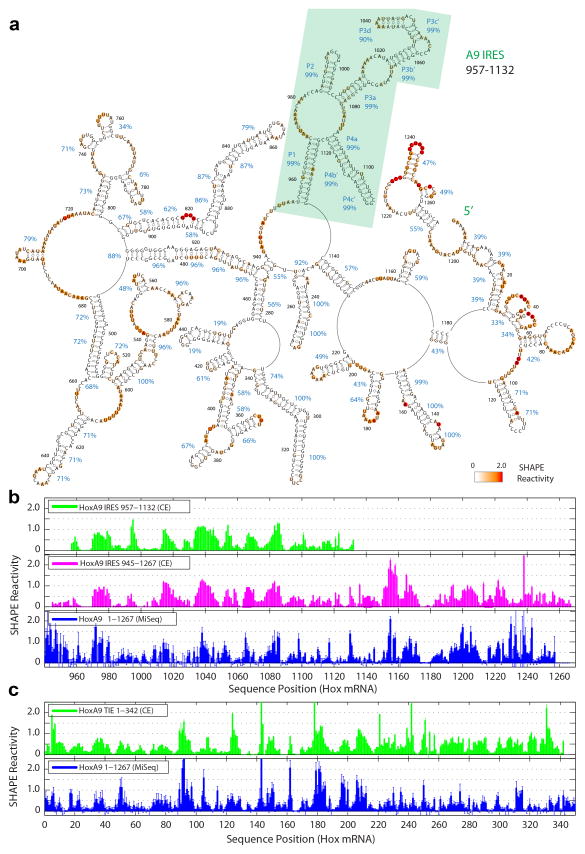
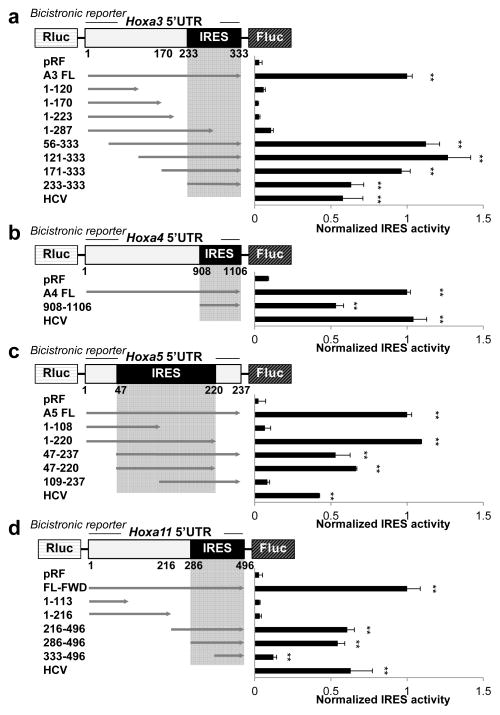
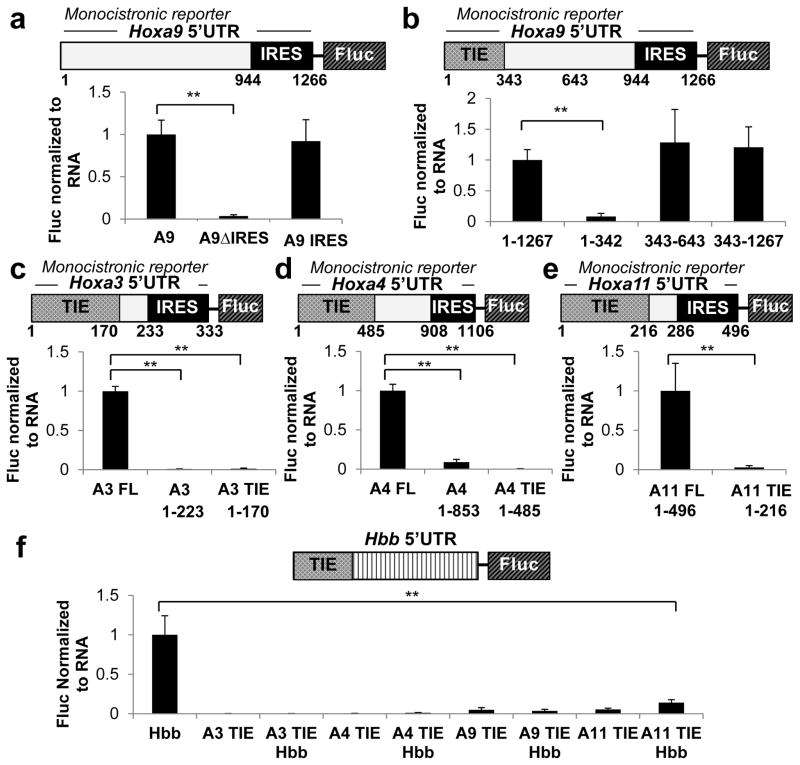
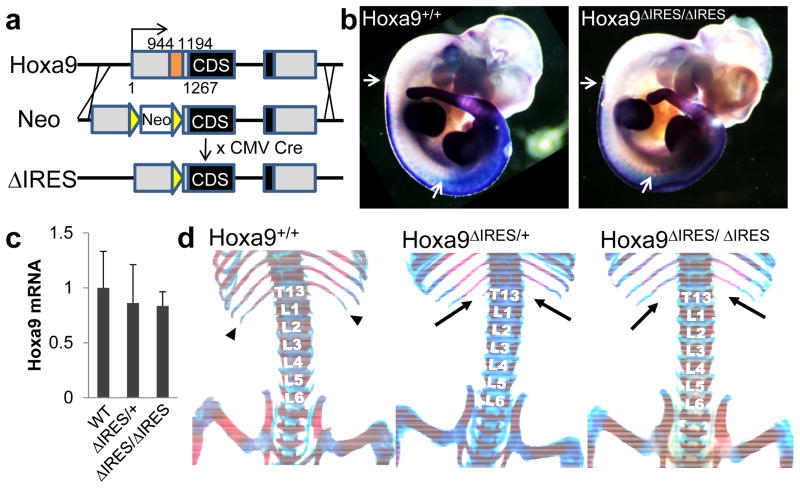
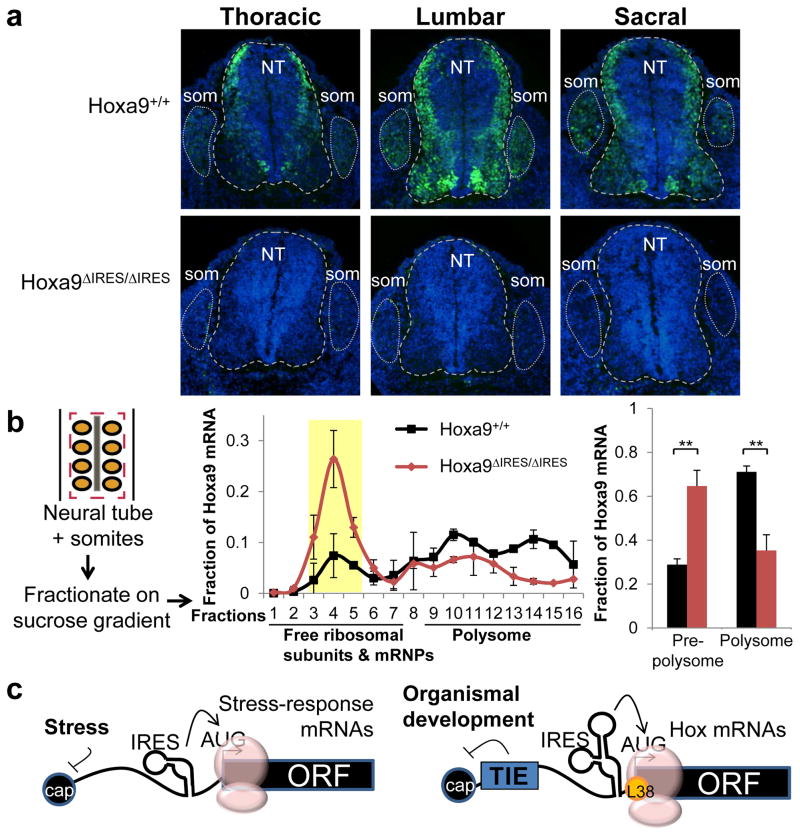
Emerging evidence suggests that the ribosome has a regulatory function in directing how the genome is translated in time and space. However, how this regulation is encoded in the messenger RNA sequence remains largely unknown. Here we uncover unique RNA regulons embedded in homeobox (Hox) 5' untranslated regions (UTRs) that confer ribosome-mediated control of gene expression. These structured RNA elements, resembling viral internal ribosome entry sites (IRESs), are found in subsets of Hox mRNAs. They facilitate ribosome recruitment and require the ribosomal protein RPL38 for their activity. Despite numerous layers of Hox gene regulation, these IRES elements are essential for converting Hox transcripts into proteins to pattern the mammalian body plan. This specialized mode of IRES-dependent translation is enabled by an additional regulatory element that we term the translation inhibitory element (TIE), which blocks cap-dependent translation of transcripts. Together, these data uncover a new paradigm for ribosome-mediated control of gene expression and organismal development.


Conflict of interest statement

The authors declare no competing interests.

Figures

Extended Data Figure 1
Extended Data Figure 1. HoxA IRES controls confirming that Fluc activity from bicistronic vector is due to IRES activity
a, qPCR of both Rluc and Fluc from transfected cells shows that Rluc and Fluc are produced at the same ratio. All Rluc and Fluc values are normalized to that of HCV (set to 1). n = 3; individual experiments performed in duplicates. b–c, shRNA against Rluc decreased reporter activity of both Rluc (a) and Fluc (b), confirming that Rluc and Fluc were transcribed on the same mRNA. n= 3 individual experiments performed in triplicates. d, RT-PCR using primers in Rluc and Fluc show that there is no cryptic splice site in the cloned Hox 5′UTR. Primer locations are shown as arrows in the diagram. e, Inserting a strong hairpin (−67 kcal/mol) after the Rluc reporter did not affect Fluc activity, suggesting Fluc activity was not due to ribosome readthrough.
Extended Data Figure 2
Extended Data Figure 2. Disruption of RPL38 in C3H10T1/2 by TALEN nucleases
a, Location of TALEN pairs. 2 pairs of TALENs were designed to bind at the end of Exon 2 and the beginning of Exon 3 to make a genomic break close to the ATG. Sequencing of a positive clone shows a deletion of the ATG and most of the intron after it. Coding sequence is highlighted in green. b RPL38 knock down does not change cap-dependent translation (Rluc) but decreases IRES-dependent translation (Fluc) from specific Hox 5′UTRs. Luciferase activity was normalized to amount of Fluc RNA in the cells as quantified by qPCR. *p< 0.05 (t-test compared to Ctrl). n = 2 individual experiments performed in duplicates.
Extended Data Figure 3
Extended Data Figure 3. Alignment of Hoxa9 IRES element between vertebrate species
Nucleotides 944 to 1266 of the mouse Hoxa9 5′UTR were aligned with sequences from other vertebrates and show high sequence homology. Nucleotides are colored based on their homology.
Extended Data Figure 4
Extended Data Figure 4. Chemical mapping and secondary structure prediction of full-length Hoxa9 5′UTR
a, Secondary structure prediction of full-length Hoxa9 using ligSHAPE data. The Hoxa9 IRES element (nt 957–1132, shaded in green) is predicted as the same secondary structure shown in Fig. 2a. b, Normalized SHAPE reactivity of Hoxa9 IRES (nt 957–1132 and 944–1266 from CE-based 1-dimensional SHAPE, full-length 1–1266 from MiSeq-based ligSHAPE). c, Normalized SHAPE reactivity of Hoxa9 TIE (nt 1–342 from CE-based 1-dimensional SHAPE, full-length 1–1266 from MiSeq-based ligSHAPE).
Extended Data Figure 5
Extended Data Figure 5. Chemical mapping and secondary structure prediction of full length Hoxa5 5′UTR
a, Secondary structure prediction of Hoxa5 using 1-dimensional SHAPE data. Nucleotides are colored with SHAPE reactivities. Percentage labels give bootstrap support values for each helix. The feature highlighted in blue resembles P3 in Hoxa9 and the tip highlighted in pink is deleted in b. b, The deletion of the tip identified in Hoxa5 IRES structure shown in a decreases IRES activity in bicistronic reporter assays. IRES activity was normalized to full length Hoxa5 5′UTR (A5, set to 1). **p< 0.01 (t-test as compared to A5). n= 2 experiments; performed in triplicates. c, Both Hoxa9 and Hoxa5 contain an asymmetric bulge in a region important for IRES activity. d-e, Normalized SHAPE (d) and DMS (e) reactivity of Hoxa5 (CE-based and MiSeq-based).
Extended Data Figure 6
Extended Data Figure 6. Secondary structure prediction and mutate-and-map (M2) dataset of Hoxa9 IRES element
a–b, Entire M2 dataset and Z-score contact-map of Hoxa9 nt 957–1132 across 177 single mutants probed by 1M7. c, Secondary structure prediction of Hoxa9 nucleotides 957–1132 using M2 data alone. The model contains the same helices as the model from combined SHAPE/ M2 analysis in Fig. 2a, up to register shifts and edge base pairs; the small rearrangements are labeled P3b′, P3c′, P3d, P4b′ and P4c′. d, Secondary structure of Hoxa9 nt 957–1132 using 1-dimensional SHAPE data alone. Nucleotides are colored with SHAPE reactivity. The model contains the same helices as the model from combined SHAPE/M2 analysis in Fig. 2a, up to register shifts and edge base pairs; the small rearrangements are labeled P3b′, P3c′, and P4c. e, Secondary structure prediction and bootstrap support matrix of Hoxa9 nt 944–1266 using 1-dimensional SHAPE data. The model agrees with the model derived from SHAPE analysis of the 957–1132 subdomain in Fig. 2a.
Extended Data Figure 7
Extended Data Figure 7. Mutation/rescue results of Hoxa9 IRES structure (nt 944–1266) probed by 1M7
Electropherograms of mutation/rescue to test base-pairings in P3c (a–b), P3b (c–e), P3a (f–k), P4b (l–o), P4a (p–u) and pk3-4 (v–ai). Perturbation of the chemical mapping reactivities by mutations of one strand and restoration by mutations in the other strand provide strong evidence for the tested pairings in P3c (a–b), P3b (c–e), P3a (f–k), P4b (m–o) and P4a (p–q). Lack of rescue in other tested pairings is consistent with either absence of those pairings or higher-order structure (e.g., base triples) interacting with those pairings.
Extended Data Figure 8
Extended Data Figure 8. Putative uORFs within the 5′UTRs of Hoxa9 and Hoxa5 do not inhibit cap-dependent translation and Hoxa9ΔIRES targeting strategy
uORFs are marked by black circles on the diagram of monocistronic reporter for the (a) Hoxa9 and (b) Hoxa5 5′UTR. All the ATGs in the 5′UTR were mutated to TTG in A9ΔuORF construct and GTG in A5ΔuORF. The IRES element (944-1266) was removed in A9 IRES construct. The IRES element was removed from the A9ΔuORF construct in A9ΔIRESΔuORF. n= 3 individual experiments in duplicates. Data represent mean ± s.d. c, Diagrams of the Hoxa9 locus and the targeting vector. Boxes represent exons, grey boxes represent UTRs and black boxes represent the coding sequence. Nucleotides 944-1145 were replaced by a floxed Neo cassette in the targeting vector. Locations of Southern blot probes, restriction enzymes used for Southern analysis and expected sizes are marked on the diagrams. d, Southern blot analysis of targeted cells using both the 5′ and 3′ probes showing that both arms integrated correctly into the Hoxa9 locus.
Extended Data Figure 9
Extended Data Figure 9. The presence of Neo cassette in the Hoxa9 locus is linked to the presence of an L1 →T13 homeotic transformation
a, Diagram of the Hoxa9 locus (top) and axial skeleton phenotype (bottom) in different Hoxa9 mouse mutants. The original Hoxa9−/− was made by replacing the homeodomain with a Neo cassette. Vertebra with homeotic transformation is colored red. b, Representative skeletons of Hoxa9+/+, Hoxa9Neo/+ and Hoxa9Neo/Neo. Arrows point to the additional rib(s) on L1, revealing a homeotic transformation to T13. These results show that it is the presence of Neo in the targeting locus, which may affect the expression of neighboring Hox gene, that is sufficient to cause the L1 → T13 phenotype. When the Neo cassette is removed from the targeting locus by crossing the Hoxa9Neo/+ mouse with a CMV Cre line, the L1 → T13 phenotype is no longer present. n = 3 embryos of each genotype.
Extended Data Figure 10
Extended Data Figure 10. Sucrose gradient fractionation shows no difference in β-actin association with polysomes in Hoxa9+/+ and Hoxa9ΔIRES/ΔIRES embryos
a, Overlay of A260 trace during fractionation showing no difference in polysome profiles between E11.5 Hoxa9+/+ and Hoxa9ΔIRES/ΔIRES embryos. b, qPCR from each fraction reveals no difference in B-actin mRNA accumulation between Hoxa9+/+ and Hoxa9ΔIRES/ΔIRES embryos. c, Quantification of B-actin mRNA in fractions. Fractions 1-8 are pre-polysomes and 9-16 are polysome fractions. n = 3 embryos of each genotype.
Figure 1
Figure 1. Select HoxA 5′UTRs contain IRES elements regulated by RPL38
a, HoxA genes are located in tandem along a chromosomal locus, and their location directs their anterior expression boundaries along the embryo. Striped boxes, Hox genes translationally regulated by RPL38. IRES activity is the ratio between Fluc and Rluc. b, IRES activity of HoxA 5′UTRs. IRES activity of UTRs was normalized to that of empty vector (pRF) and RPL38-regulated Hox genes are denoted in red. ** p< 0.01 (t-test as compared to pRF). n= 5. c, RPL38 regulates translation of specific HoxA IRES elements. Bicistronic reporters were transfected into control cells (CTRL) or cells where one copy of Rpl38 was deleted (RPL38 KD). Top: Western blot of RPL38 and β-actin with quantification of RPL38 levels below blot. Bottom: IRES activity of specific Hox 5′UTRs in RPL38 KD cells normalized to that of control cells. ** p< 0.01 (t-test). n= 3. d, Deletion analysis of the Hoxa9 5′UTR. IRES activity was normalized to that of the full-length Hoxa9 5′UTR (A9). AS: anti-sense. **p<0.01 (t-test as compared to pRF). n= 3. e, IRES activity of the Hoxa9 IRES (nt 944–1266) in RPL38 KD cells. **p<0.01 (t-test). n= 3. f, Alignment of the Hoxa9 5′UTR in vertebrates. g, The 5′UTR of one of two zebrafish Hoxa9 paralogs (Hoxa9b) has similar IRES activity as the mouse Hoxa9 IRES. IRES activity was normalized to pRF. **p< 0.01 (t-test as compared to pRF). n= 3. All experiments were performed in triplicates. Data represent mean ± s.d.
Figure 2
Figure 2. The Hoxa9 IRES forms a stable RNA structure that facilitates recruitment of the ribosome
a, Secondary structure of Hoxa9 5′UTR (nt 957–1132) by SHAPE and mutate-and-map analysis. Nucleotides are colored with SHAPE reactivities. Percentages give bootstrap support values for each helix, including a tentative pseudoknot (pk). Base-pairs verified by mutation and rescue are circled green. Inset: mutations made in helix P3a for functional testing in b. b, Deletions as well as mutation-and-rescue of specific hairpins identified in Hoxa9 IRES structure shown in a affects IRES activity in bicistronic reporter assays. IRES activity was normalized to full-length Hoxa9 5′UTR (A9, set to 1). **p< 0.01 (t-test as compared to A9). n= 3 experiments performed in triplicates. c, Schematic of RNA pull-down experiments. d, e, Representative western blot for RPs (d) and qPCR for rRNA (e) from elutes of two independent RNA pull-down experiments. The 18S and 28S rRNA amounts of all Hoxa9 deletion mutants were normalized to amount of full-length Hoxa9 5′UTR (set to 1) eluted from beads. n= 2. Data represent mean ± s.d.
Figure 3
Figure 3. Identification of minimal IRES domains in all IRES-containing HoxA 5′UTRs
Deletion analysis of HoxA 5′UTRs performed in bicistronic constructs maps the IRES element in Hoxa3 (a), Hoxa4 (b), Hoxa5 (c) and Hoxa11 (d). IRES activity was normalized to full-length 5′UTRs (FL). ** p< 0.01 (t-test compared to pRF). n= 3 experiments performed in triplicates. Data represent mean ± s.d.
Figure 4
Figure 4. Identification of the TIE that blocks cap-dependent translation
a, Deletions within the Hoxa9 5′UTR in a monocistronic reporter assay. Fluc activity was normalized to amount of luciferase mRNA determined by qPCR. All values are normalized to Hoxa9 full-length 5′UTR (A9), set to 1. n= 4. b, A TIE that inhibits cap-dependent translation was identified in the Hoxa9 5′UTR (nt 1–342). n= 3. c-e, Deletion of the minimal IRES elements within monocistronic reporters of HoxA 5′UTRs and identification of TIEs close to the mRNA cap in Hoxa3 (c), Hoxa4 (d) and Hoxa5 (e). All values are normalized to the full-length constructs (FL). n= 3. f, HoxA TIEs were placed upstream of the β-globin 5′UTR (Hbb) in a monocistronic reporter to assay inhibition of cap-dependent translation. n= 3. All experiments were performed in duplicates. Data represent mean ± s.d. **p< 0.01 (t-test).
Figure 5
Figure 5. The Hoxa9 IRES is required for axial skeleton patterning but not for Hoxa9 mRNA expression
a, Scheme of Hoxa9 IRES targeted deletion in the mouse. LoxP sites are depicted by yellow triangles. The region deleted is highlighted in orange. b, Representative in situ hybridization of Hoxa9 mRNA expression at E11.5. n = 3 embryos of each genotype. Arrows indicate the anterior boundaries of expression in the neural tube and somites. c, qPCR shows little change in Hoxa9 transcript levels in neural tube and somites of Hoxa9ΔIRES/+ and Hoxa9ΔIRES/ΔIRES embryos. Hoxa9ΔIRES/+, p = 0.06; Hoxa9ΔIRES/ΔIRES p = 0.03, t-test as compared to Hoxa9+/+. n ≥ 4 embryos of each genotype. d, Representative skeletons of Hoxa9+/+, Hoxa9ΔIRES/+ and Hoxa9ΔIRES/ΔIRES mice. Arrows point to the missing rib(s) on T13, normally present in WT mice (arrowheads) revealing a posterior homeotic transformation to L1. n = 5 mice of each genotype.
Figure 6
Figure 6. The Hoxa9 IRES is critically required for HOXA9 translation in vivo
a, Representative immunostaining of HOXA9 (green) in cross-section of E11.5 Hoxa9+/+ (top) and Hoxa9ΔIRES/ΔIRES (bottom) embryos from the thoracic to sacral levels. DAPI staining is in blue. NT: neural tube, som: somite. n = 3 embryos of each genotype. b, Somites and neural tubes of E11.5 Hoxa9+/+ and Hoxa9ΔIRES/ΔIRES embryos were microdissected and fractionated on a sucrose gradient. Middle: qPCR of Hoxa9 mRNA from each fraction. Early pre-polysome fractions are highlighted. Right: quantification of Hoxa9 mRNA in fractions. Fractions 1–8 are pre-polysome and 9–16 polysome fractions. **p< 0.01 (t-test compared to Hoxa9+/+). n = 3 embryos of each genotype. c, Model for how ribosome-mediated regulation of gene expression is encoded within mRNA sequence. Stress-responsive cellular IRES elements are only active when cap-dependent translation is down-regulated through a decrease in eIF4F activity. HoxA mRNAs possess a TIE, which normally inhibits cap-dependent translation. The TIE enables ribosome-mediated control of HoxA IRES expression during embryonic development.

Comment in

Similar articles

Cited by

References

    1. Kondrashov N, et al. Ribosome-Mediated Specificity in Hox mRNA Translation and Vertebrate Tissue Patterning. Cell. 2011;145:383–397. - PMC - PubMed
    1. Lee A, Burdeinick-Kerr R, Whelan S. A ribosome-specialized translation initiation pathway is required for cap-dependent translation of vesicular stomatitis virus mRNAs. Proc Natl Acad Sci U S A. 2013;110:324–329. - PMC - PubMed
    1. Vesper O, et al. Selective Translation of Leaderless mRNAs by Specialized Ribosomes Generated by MazF in Escherichia coli. Cell. 2011;147:147–157. - PMC - PubMed
    1. Xue S, Barna M. Specialized ribosomes: a new frontier in gene regulation and organismal biology. Nat Rev Mol Cell Biol. 2012;13:355–369. - PMC - PubMed
    1. Dinman JD. The eukaryotic ribosome: current status and challenges. J Biol Chem. 2009;284:11761–5. - PMC - PubMed

Publication types

MeSH terms

Associated data