. 2015 Jan 15;308(2):E130-43.
doi: 10.1152/ajpendo.00344.2014. Epub 2014 Nov 18.

Somatostatin and insulin mediate glucose-inhibited glucagon secretion in the pancreatic α-cell by lowering cAMP

Affiliations

Somatostatin and insulin mediate glucose-inhibited glucagon secretion in the pancreatic α-cell by lowering cAMP

Amicia D Elliott et al. Am J Physiol Endocrinol Metab. .

Abstract

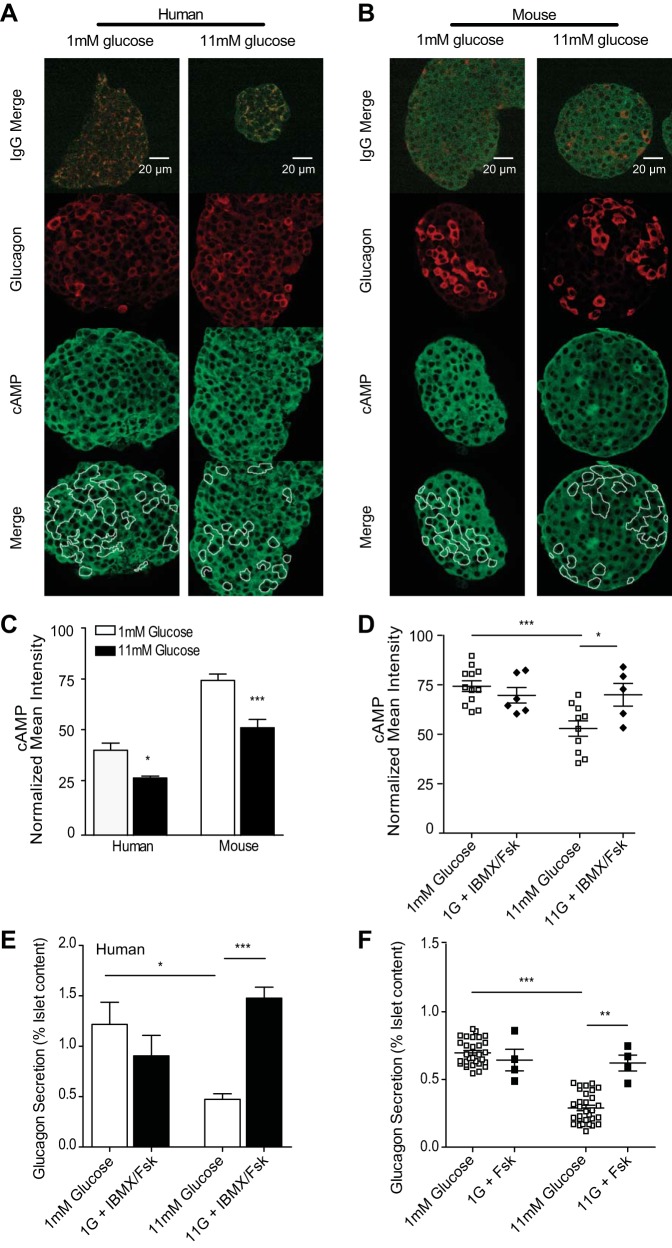
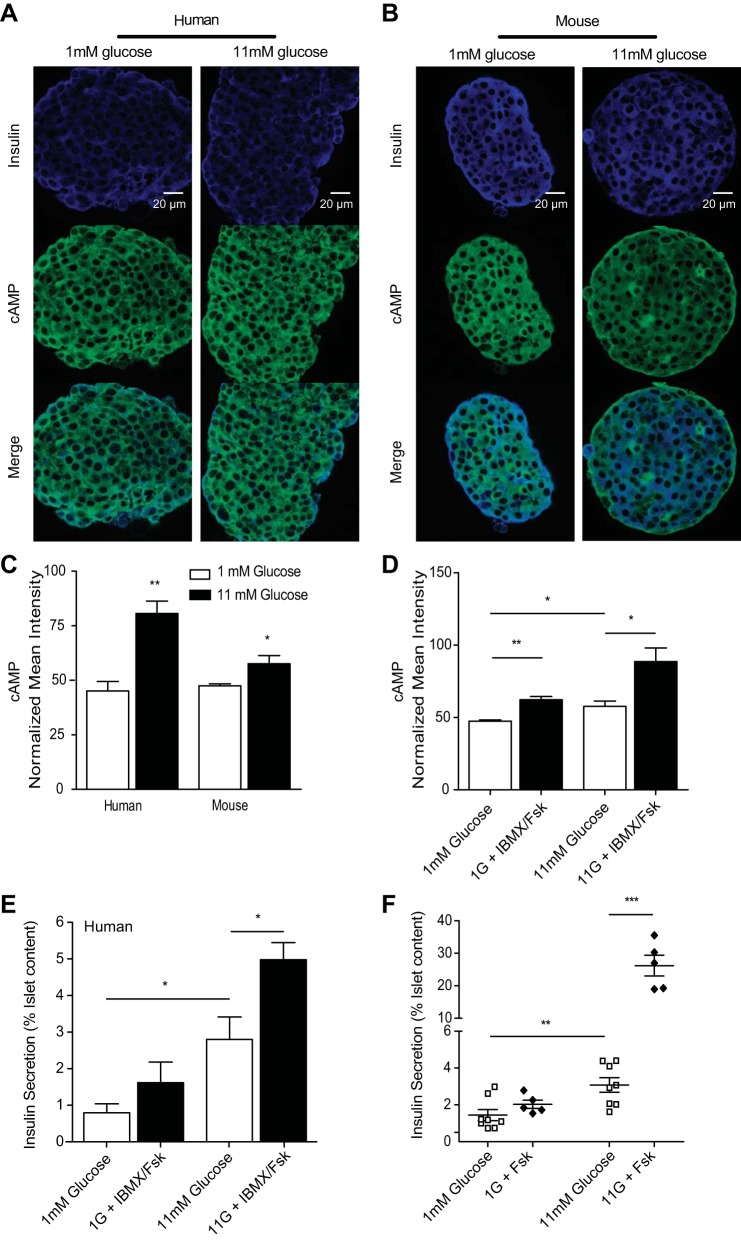
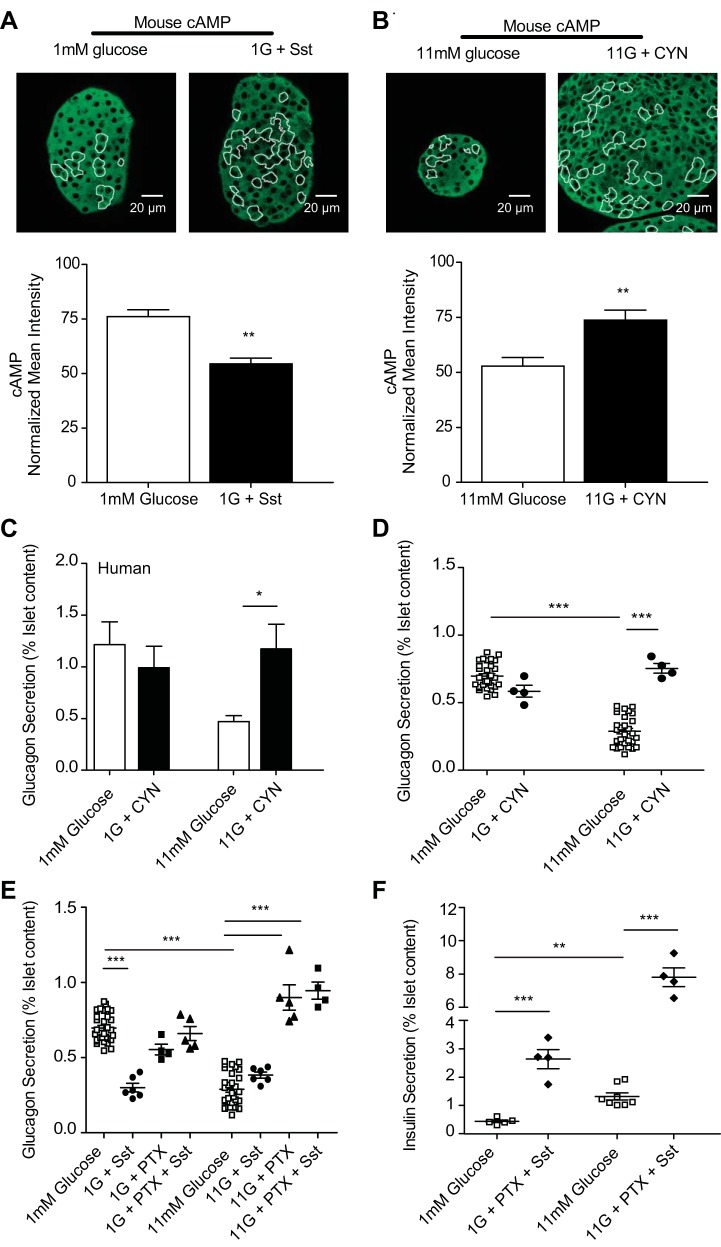
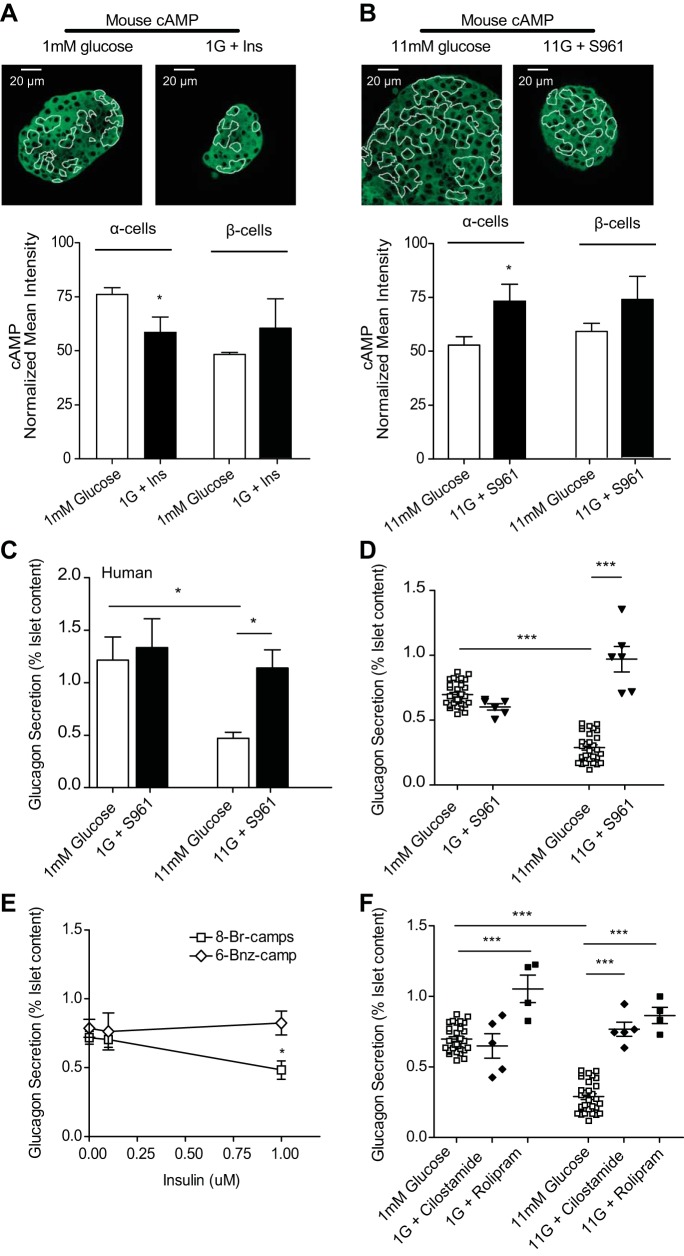
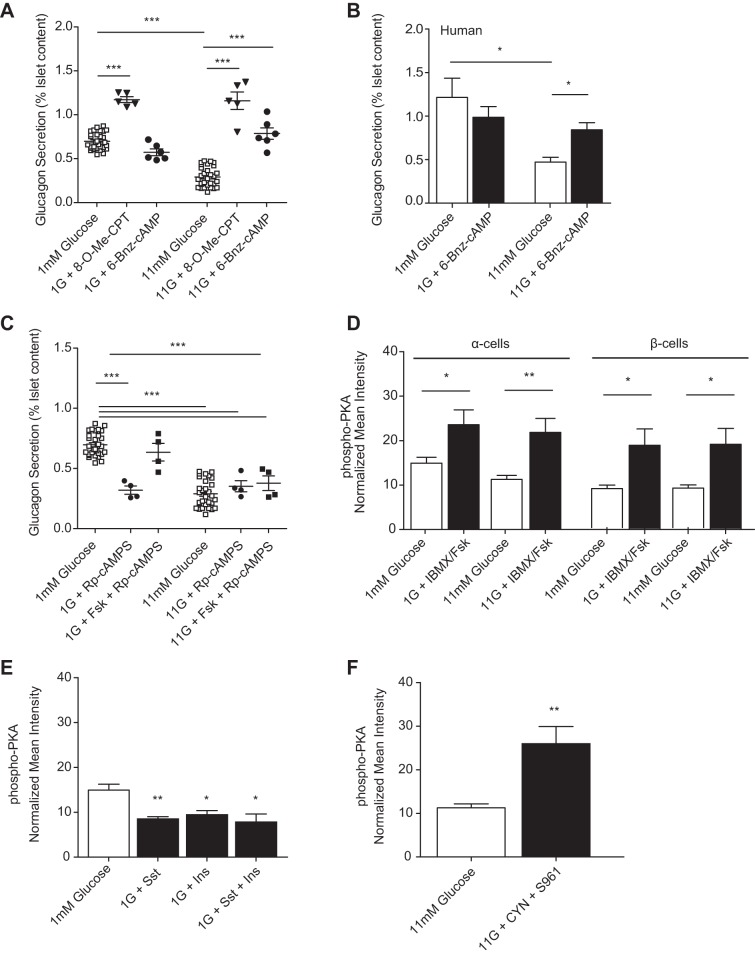
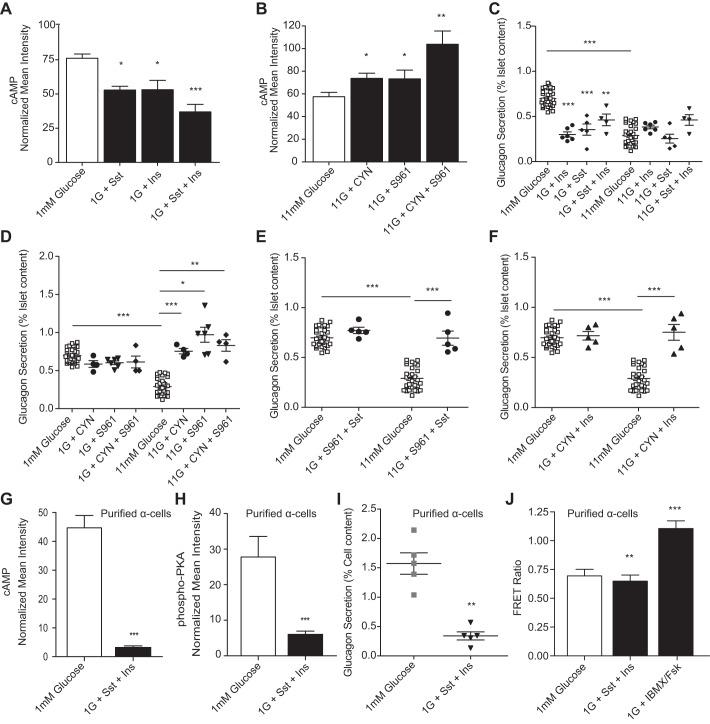
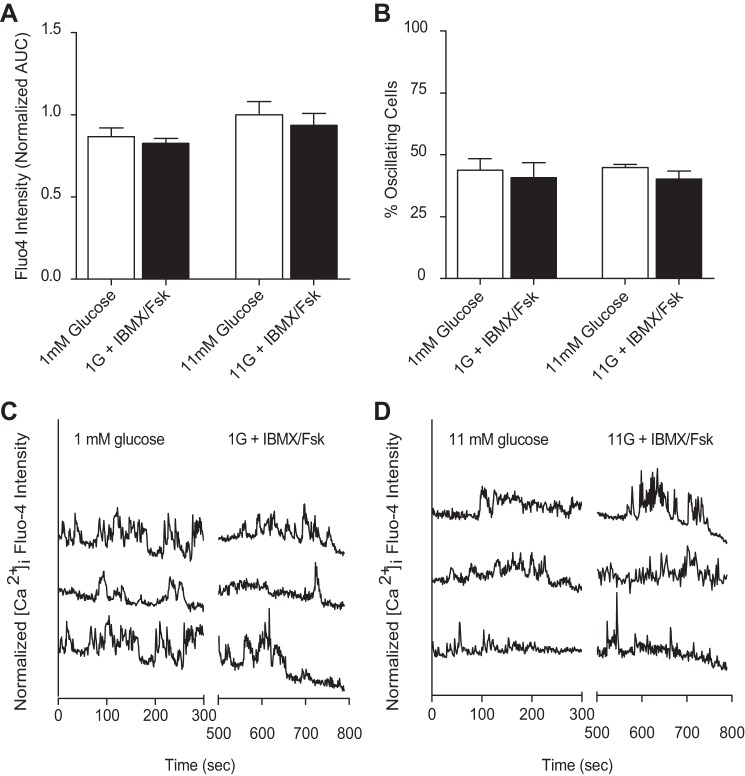
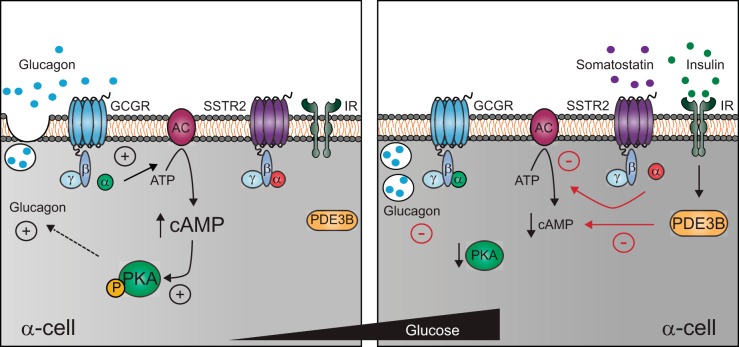
The dysregulation of glucose-inhibited glucagon secretion from the pancreatic islet α-cell is a critical component of diabetes pathology and metabolic disease. We show a previously uncharacterized [Ca(2+)]i-independent mechanism of glucagon suppression in human and murine pancreatic islets whereby cAMP and PKA signaling are decreased. This decrease is driven by the combination of somatostatin, which inhibits adenylyl cyclase production of cAMP via the Gαi subunit of the SSTR2, and insulin, which acts via its receptor to activate phosphodiesterase 3B and degrade cytosolic cAMP. Our data indicate that both somatostatin and insulin signaling are required to suppress cAMP/PKA and glucagon secretion from both human and murine α-cells, and the combination of these two signaling mechanisms is sufficient to reduce glucagon secretion from isolated α-cells as well as islets. Thus, we conclude that somatostatin and insulin together are critical paracrine mediators of glucose-inhibited glucagon secretion and function by lowering cAMP/PKA signaling with increasing glucose.

Keywords: cyclic AMP; glucagon; insulin; pancreatic islets; somatostatin.


Figures

Fig. 1.
Fig. 1.
Increasing cAMP overcomes glucose-inhibited glucagon secretion in human and murine α-cells. AD: immunofluorescence and quantitation of mean intensities from donor human or isolated murine islets statically incubated with 1 (open bars) or 11 mM glucose (black bars) in the absence and presence (D) of 50 μM forskolin (Fsk) or 100 μM 3-isobutyl-1-methylxanthine (IBMX) before fixing and staining for glucagon and cAMP. Images from representative human islets (A) and murine islets (B) shown with merged preimmune controls (top); glucagon in red and cAMP in green. C: mean intensities for each channel were normalized to preimmune controls, and data were averaged across donor islets from 4 humans and islets isolated from 10 mice. D: mean intensities from murine islets stained for cAMP and glucagon after treatment with Fsk and IBMX (⧫) or glucose alone (□). Each dot represents the average of 2–5 islets from one mouse. E: glucagon secretion from human islets treated as for immunofluorescence with glucose alone (open bars) or glucose with Fsk and IBMX (black bars). F: murine islet glucagon secretion with glucose alone (□) or glucose with Fsk (■). Error bars represent the SE across mice in each experiment; P values were determined by Student's t-test. *P < 0.05; **P < 0.01; ***P < 0.0001.
Fig. 2.
Fig. 2.
cAMP is increased with increasing glucose in islet β-cells. A and B: immunofluorescence and quantitation of mean intensities from donor human or isolated murine islets statically incubated with 1 (open bars) or 11 mM glucose (black bars) before fixing and staining for insulin and cAMP. Images from representative human islets (A) and murine islets (B); insulin in blue and cAMP in green. C: mean intensities for each channel were normalized to preimmune controls from their respective tissues, and data were averaged across islet β-cells, as in Fig. 1. D: cAMP mean intensities from murine islet β-cells treated with 1 or 11 mM glucose alone or with IBMX/Fsk. E and F: insulin secretion from islets of 4 human donors (E) or islets isolated from 5 mice (F) that were exposed to 1 or 11 mM glucose in the presence (⧫) and absence (□) of 50 μM forskolin in a static incubation assay. Error bars represent the SE across mice in each experiment, and P values were determined by Student's t-test. *P < 0.05; **P < 0.01; ***P < 0.0001.
Fig. 3.
Fig. 3.
Somatostatin (Sst) inhibits cAMP production via the Gαi subunit of Sst receptor 2 (SSTR2), which is critical for glucagon suppression. A and B: mean intensities from immunofluorescence studies, where islets were fixed after treatment and stained for cAMP and glucagon and normalized to preimmune controls. Islets were treated with 100 nM Sst at 1 mM glucose (n = 6) or with glucose alone (n = 13) (A) or 200 nM SSTR2 antagonist CYN154806 (CYN) at 11 mM glucose (n = 8) or with glucose alone (n = 10) (B); cAMP in green, glucagon-positive cells outlined in white. CE: glucagon secretion from donor human or isolated murine islets statically incubated with 200 nM CYN at 1 and 11 mM glucose. C: human islet glucagon secretion (n = 3–5 donors) with glucose alone (open bars) or with CYN (black bars). D: isolated murine islet glucagon secretion with glucose alone (□) and CYN-treated islets (●). E: murine islets pretreated with 1 mg/ml pertussis toxin (PTX) for 18 h were stimulated with 100 nM Sst (▲) at 1 or 11 mM glucose. Control islets treated with glucose alone (□), 100 nM Sst (●), or PTX alone (■) are also displayed. F: insulin secretion from isolated murine islets from E treated with PTX and Sst. Error bars represent the SE across 4–8 mice/experiment, and P values were determined by Student's t-test. *P < 0.05; **P < 0.01; ***P < 0.0001.
Fig. 4.
Fig. 4.
Insulin drives degradation of cAMP by activating phosphodiesterase 3B (PDE3B) in α-cells and is required for glucose-inhibited glucagon secretion. A and B: mean intensities from immunofluorescence where islets were fixed after treatment and stained for cAMP and glucagon and normalized to preimmune controls. A: islets were treated with 100 nM insulin at 1 mM glucose (n = 5) or glucose alone (n = 13); cAMP in green, glucagon outlined in white. B: islets were treated with 1 μM S961 (n = 6) at 11 mM glucose or with glucose alone (n = 10); cAMP in green, glucagon outlined in white. CF: glucagon secretion from statically incubated donor human or isolated murine islets treated as above. C: glucagon secretion from 4 donor human islets incubated with 1 μM insulin receptor antagonist S961 at 1 or 11 mM glucose (black bars) and glucose-alone controls (open bars). D: glucagon secretion from isolated murine islets treated with S961 at 1 or 11 mM glucose (▼) or glucose-alone controls (□). E: at 11 mM glucose, glucagon secretion from islets treated with hydrolyzable 300 μM 8-bromoadenosine 3′,5′-cyclic monophosphate (8-Br-cAMP; □) and no exogenous insulin (n = 6), 100 nM insulin (n = 6), or 1 μM insulin (n = 5); 300 μM nonhydrolyzable N6-benzoyladenosine-3′,5′-cyclic monophosphate sodium salt (6-Bnz-cAMP; ◇) was also tested with no insulin (n = 6), 100 nM insulin (n = 4), or 1 μM insulin (n = 4). F: glucagon secretion from islets treated with PDE inhibitors 250 nM cilostamide (PDE3B; n = 5) or 400 nM rolipram (PDE4; n = 4) at 1 and 11 mM glucose. Error bars represent the SE, and P values were determined by Student's t-test. *P < 0.05; ***P < 0.0001.
Fig. 5.
Fig. 5.
Insulin (Ins) and Sst also decrease PKA glucose-dependently, which must be lowered for glucagon suppression. A: glucagon secretion from murine islets after stimulation with glucose alone (□), 300 μM exchange protein activated by cAMP agonist 8-(4-chlorophenylthio)-2′-O-methyladenosine 3′,5′-cyclic monophosphate monosodium hydrate (8-O-Me-CPT; ▼), or 300 μM PKA agonist 6-Bnz-cAMP (●) at 1 and 11 mM glucose. B: human islet glucagon secretion after stimulation with glucose alone (open bars) or 300 μM PKA agonist 6-Bnz-cAMP (black bars) at 1 and 11 mM glucose. C: glucagon secretion from murine islets treated with glucose alone (□), 50 μM forskolin, forskolin and 100 μM PKA-specific antagonist Rp-cAMPS (■), or Rp-cAMPS alone (●). DF: normalized mean intensities from islets or purified α-cells treated with glucose alone or with 50 μM Fsk and 100 μM IBMX, 100 nM Sst, 100 nM Ins, combined somatostatin and insulin, or combined 200 nM CYN and 1 μM S961 and then fixed and stained for phospho-PKA and glucagon. D: normalized phospho-PKA intensity from islet α-cells or β-cells treated at 1 (open bars) or 11 mM glucose (black bars) with IBMX/Fsk (n = 6) or alone (n = 7). E: normalized phospho-PKA (n = 6) intensity from islet α-cells incubated with 1 mM glucose alone (n = 7; open bar) or in the presence of Sst, Ins, or Sst with Ins (n = 5, 4, and 5, respectively; black bars). F: normalized phospho-PKA (n = 4) intensity from islet α-cells treated with 11 mM glucose alone (open bar) or with CYN and S961 (black bar). Error bars represent the SE across 4–8 mice/experiment, and P values were determined by Student's t-test. *P < 0.05; **P < 0.01; ***P < 0.0001.
Fig. 6.
Fig. 6.
Sst and insulin signaling converges to decrease cAMP in glucose-inhibited glucagon secretion. A and B: normalized mean intensities from islets stimulated with combined 100 nM Sst and 100 nM Ins (black bars), combined 1 μM S961 and 200 nM CYN (black bars), or glucose-only controls (open bars) and then fixed and stained for cAMP and glucagon and normalized to preimmune controls. A: normalized cAMP intensity from islet α-cells treated with 1 mM glucose (n = 13), Sst (n = 6), Ins (n = 5), or Sst with Ins at 1 mM glucose (n = 7). B: normalized cAMP intensity from islet α-cells treated with 11 mM glucose (n = 13), CYN (n = 8), S961 (n = 6), or CYN with S961 at 11 mM glucose (n = 4). CF: glucagon secretion from islets treated with glucose or glucose in the presence of combinations of Sst, Ins, CYN, and/or S961. C: glucagon secretion from islets stimulated with Ins (●), Sst (⧫), combined Sst and Ins (▼), or glucose alone (□). D: glucagon secretion from islets treated with CYN (●), S961 (▼), CYN and S961 (⧫), or glucose-only controls (□). E: glucagon secretion from islets treated with S961 and Sst (●) or glucose alone (□). F: islet glucagon secretion after treatment with CYN and Ins (▲) or glucose alone (□). G and H: tandem-dimer red fluorescent protein (tdRFP)-expressing α-cells were purified from isolated murine islets (n = 5 mice) and treated with either 1 mM glucose in the absence and presence of 100 nM Sst and 100 nM Ins and either fixed and stained for cAMP, phospho-PKA, and glucagon or assessed for glucagon secretion. G: normalized cAMP intensities from purified α-cells treated with either 1 mM glucose (open bar) or 1 mM glucose with Ins and Sst (black bar). H: normalized phospho-PKA intensities from purified α-cells treated with either 1 mM glucose or 1 mM glucose with Ins and Sst. I: glucagon secretion from isolated α-cells treated in static incubation with 1 mM glucose (gray squares) or 1 mM glucose with 100 nM somatostatin and 100 nM insulin (▼). J: purified α-cells were electroporated with a cAMP Förster resonance energy transfer (FRET) biosensor and treated with 1 mM glucose, 1 mM glucose with 100 nM Sst and 100 nM insulin, or 100 μM IBMX and 50 μM Fsk. Error bars represent the SE, and P values were determined by Student's t-test. *P < 0.05, **P < 0.01, and ***P < 0.0001, unless otherwise indicated.
Fig. 7.
Fig. 7.
cAMP stimulation is independent of changes in α-cell intracellular Ca2+ ([Ca2+]i). Isolated murine islets were exposed to 1 or 11 mM glucose in the absence (open bars) and presence (black bars) of 50 μM Fsk or 100 μM IBMX and subjected to Ca2+ imaging via fluo 4 intensity measurements. A: [Ca2+]i as measured by fluo 4 intensity [area under the curve (AUC)] in murine isolated islets treated with glucose alone (open bars) or in the presence of 50 μM Fsk and 100 μM IBMX (black bars). B: mean %cells with oscillations in Ca2+ as a function of glucose, where α-cells were identified by tdRFP expression in 2–4 islets from 4 mice. C and D: representative [Ca2+]i response to glucose alone or IBMX/Fsk stimulation at 1 (C) and 11 mM (D) glucose. Time course traces are offset for clarity.
Fig. 8.
Fig. 8.
Schematic of glucagon inhibition via insulin and somatostatin's effects on cAMP in α-cells at low and high glucose. Illustration of the stimulatory effect of cAMP via PKA on glucagon secretion from the pancreatic α-cell (left) and the inhibitory roles of insulin and somatostatin in lowering cAMP signaling at high glucose (right). In response to hypoglycemia, glucagon secretion is stimulated in a cAMP and Ca2+-dependent manner. As plasma glucose rises, ATP and cAMP production increase, as well as protein kinase A (PKA) activation, which must be inhibited for glucagon secretion to be suppressed in the α-cells. Somatostatin and insulin are released in response to rising glucose from the δ- and β-cells, respectively. Somatostatin binds the SSTR2 receptor and prevents further production of cAMP via the inhibitory G protein αi-subunit. Additionally, insulin activates PDE3B to drive degradation of cAMP and inhibit PKA signaling. The coordination of somatostatin and insulin to reduce cAMP-dependent exocytosis is required for the inhibition of glucagon secretion at high glucose levels. GCGR, glucagon receptor; P, phosphorylated PKA.

Similar articles

Cited by

References

    1. Ahmad F, Lindh R, Tang Y, Ruishalme I, Ost A, Sahachartsiri B, Strålfors P, Degerman E, Manganiello VC. Differential regulation of adipocyte PDE3B in distinct membrane compartments by insulin and the beta3-adrenergic receptor agonist Cl316243: effects of caveolin-1 knockdown on formation/maintenance of macromolecular signalling complexes. Biochem J 424: 399–410, 2009. - PMC - PubMed
    1. Beebe SJ, Redmon JB, Blackmore PF, Corbin JD. Discriminative insulin antagonism of stimulatory effects of various cAMP analogs on adipocyte lipolysis and hepatocyte glycogenolysis. J Biol Chem 260: 15781–15788, 1985. - PubMed
    1. Bender AT, Beavo JA. Cyclic nucleotide phosphodiesterases: molecular regulation to clinical use. Pharmacol Rev 58: 488–520, 2006. - PubMed
    1. Benninger RK, Head WS, Zhang M, Satin LS, Piston DW. Gap junctions and other mechanisms of cell-cell communication regulate basal insulin secretion in the pancreatic islet. J Physiol 589: 5453–5466, 2011. - PMC - PubMed
    1. Bramswig NC, Everett LJ, Schug J, Dorrell C, Liu C, Luo Y, Streeter PR, Naji A, Grompe M, Kaestner KH. Epigenomic plasticity enables human pancreatic alpha to beta cell reprogramming. J Clin Invest 123: 1275–1284, 2013. - PMC - PubMed

Publication types

LinkOut - more resources