. 2014 Nov 18:5:5413.
doi: 10.1038/ncomms6413.

MNKs act as a regulatory switch for eIF4E1 and eIF4E3 driven mRNA translation in DLBCL

Affiliations

MNKs act as a regulatory switch for eIF4E1 and eIF4E3 driven mRNA translation in DLBCL

Ari L Landon et al. Nat Commun. .

Abstract

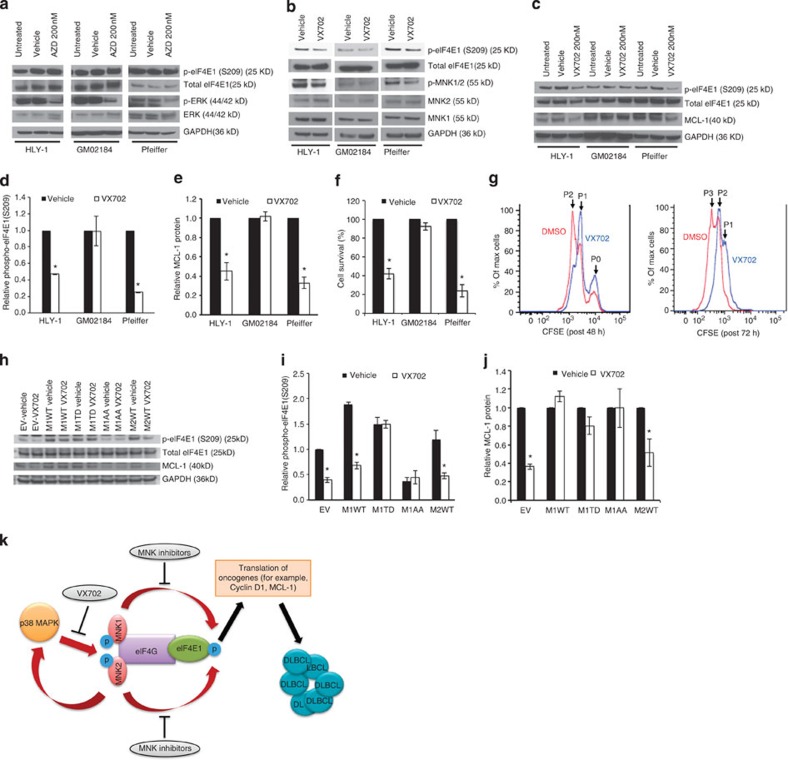
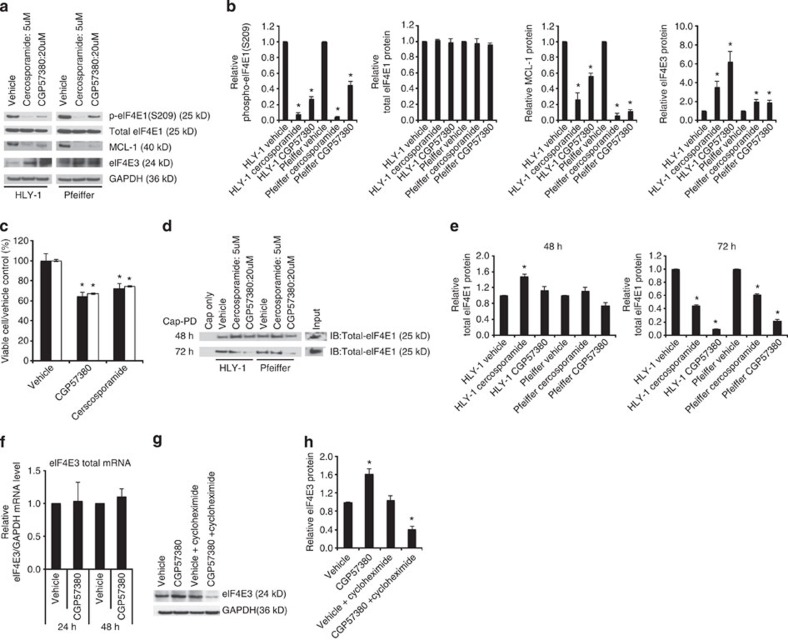
The phosphorylation of eIF4E1 at serine 209 by MNK1 or MNK2 has been shown to initiate oncogenic mRNA translation, a process that favours cancer development and maintenance. Here, we interrogate the MNK-eIF4E axis in diffuse large B-cell lymphoma (DLBCL) and show a distinct distribution of MNK1 and MNK2 in germinal centre B-cell (GCB) and activated B-cell (ABC) DLBCL. Despite displaying a differential distribution in GCB and ABC, both MNKs functionally complement each other to sustain cell survival. MNK inhibition ablates eIF4E1 phosphorylation and concurrently enhances eIF4E3 expression. Loss of MNK protein itself downregulates total eIF4E1 protein level by reducing eIF4E1 mRNA polysomal loading without affecting total mRNA level or stability. Enhanced eIF4E3 expression marginally suppresses eIF4E1-driven translation but exhibits a unique translatome that unveils a novel role for eIF4E3 in translation initiation. We propose that MNKs can modulate oncogenic translation by regulating eIF4E1-eIF4E3 levels and activity in DLBCL.


Figures

Figure 1
Figure 1. MNK1 and MNK2 expression in non-malignant (GM02184), malignant (DLBCL) cell lines and primary tissue samples.
(a) RT–qPCR analysis of MNK1 (black bar) and MNK2 (grey bar) total mRNA in ABC- and GCB-DLBCL cell lines compared with GAPDH mRNA (mean±s.e.m., n=3, *P-value of Student’s t-test <0.05). (b) Western blot analysis of MNK1 and MNK2 protein expression in ABC- and GCB-DLBCL cell lines with GAPDH loading control. Densitometry analysis is shown in Supplementary Fig. 1a. (c,d) RT–qPCR analysis of (c) MNK1 or (d) MNK2 mRNA levels in total RNA extracted from primary tissue microarray preclassified as normal lymph node (LN, black bar), GCB- (white bar) or ABC- (grey bar) DLBCL, relative to (c) MNK1 or (d) MNK2 levels in normal lymph node (mean±s.e.m., n=3, *P-value of Student’s t-test <0.05). (e) Survival-rescue experiment of HLY-1 DLBCL, 48 h after transduction of non-target (NT, black bar) or MNK1 shRNA (M1KD, white bar) in both empty vector (EV) and MNK2 WT (M2WT) overexpressing cells, measured by trypan blue exclusion assay (mean±s.d., n=3, *P-value of Student’s t-test <0.05). (f) Survival-rescue experiment of HLY-1 DLBCL, 48 h after transduction of non-target (NT, black bar) or MNK2 shRNA (M2KD, white bar), in both empty vector (EV) and MNK1 WT (M1WT) overexpressing cells, measured by trypan blue exclusion assay (mean±s.d., n=3, *P-value of Student’s t-test <0.05). (g) Western blot analysis of total and phospho-eIF4E1(S209) as well as MNK1, MNK2 and GAPDH for MNK1 KD rescue experiment from Fig. 1e in HLY-1 expression mutants. Densitometry analysis is shown in Supplementary Fig. 1b. (h) Western blot analysis of total and phospho-eIF4E1(S209) as well as MNK1, MNK2 and GAPDH for MNK2 KD rescue experiments from Fig. 1f in HLY-1 expression mutants. Densitometry analysis is shown in Supplementary Fig. 1c (i) Representative cell cycle analysis from three independent experiments of stable cell lines expressing empty vector, wild-type MNK1 (MNK1) or MNK1 phosphonull mutant (MNK1-AA) in non-malignant B-cell line GM02184 and DLBCL cell lines HLY-1 and Pfeiffer. Full immunoblots are shown in Supplementary Fig. 10.
Figure 2
Figure 2. p38 is the primary regulator of MNK-driven eIF4E1 phosphorylation in DLBCL.
(a) Western blot analysis of total and phospho-eIF4E1(S209) as well as total and phospho-ERK after 24 h treatment with an MEK inhibitor AZD6244 (AZD 200 nM), compared with untreated and vehicle controls in HLY-1, GM02184 and Pfeiffer cell lines. Densitometry analysis is shown in Supplementary Fig. 1e. (b) Western blot analysis of phospho-MNKs (antibody detects p-MNK1 and p-MNK2), total MNK1, total MNK2, total and phospho-eIF4E1(S209) after 1 h treatment with a p38 inhibitor VX702 (200 nM). Densitometry analysis is shown in Supplementary Fig. 1f. (c) Western blot analysis of total and phospho-eIF4E1 and MCL-1 post 4 h treatment with a p38 inhibitor VX702. (d) Densitometry analysis of phospho-eIF4E1(S209) and (e) MCL-1 band intensity of western blot in Fig. 2c, relative to GAPDH following 4 h treatment with vehicle (black bar) or 200 nM VX702 (white bar). Mean±s.d., n=3, *P-value of Student’s t-test <0.05. (f) Trypan blue exclusion assay of HLY-1, GM02184 and Pfeiffer cells after 72 h treatment with vehicle (black bar) or 200 nM VX702 (white bar). Mean±s.d., n=3, *P-value of Student’s t-test <0.001. (g) Representative CFSE analysis of HLY-1 cells 48 and 72 h post treatment with 200 nM VX702 (blue line) or vehicle (DMSO; red line). P0 denotes initial population, while P1, P2 and P3 denote subsequent daughter cell populations. Three independent experiments are shown in Supplementary Fig. 4a. (h) Western blot showing total and phospho-eIF4E1(S209) as well as MCL-1 with or without 4 h treatment with 200 nM VX702 in HLY-1 cells expressing empty vector (EV), MNK1-wildtype (M1WT), MNK1-phosphomimetic (M1TD), MNK1-phosphonull (M1 AA), and MNK2-wildtype (M2WT). (i,j) Densitometry analysis showing relative band intensity of (i) phospho-eIF4E1(S209) or (j) MCL-1 to GAPDH in HLY-1 cells treated with vehicle (black bar) or 200 nM VX702 (white bar) for 4 h of immunoblot in Fig. 2h (mean±s.d., n=3, *P-value of Student’s t-test <0.05). (k) Summarizing figure illustrating the p38-regulated MNK-dependent eIF4E1 phosphorylation in DLBCL cells. Cartoon depicts two potential modes of disrupting the p38-MNK-eIF4E1 axis in DLBCL, that are, via the use of p38 or MNK inhibitors. Full immunoblots are shown in Supplementary Fig. 10.
Figure 3
Figure 3. MNK expression regulates eIF4E1 in a dose-dependent manner.
(a) Western blot showing total and phospho-eIF4E1(S209), MCL-1, eIF4E3 and MNK2 of HLY-1 cells 48 h post-transduction with two pre-validated MNK2 shRNAs at MOI of 1 to 20. (be) Densitometry analysis showing band intensity relative to GAPDH of (b) phospho-eIF4E1(S209), (c) MNK2, (d) MCL-1 and (e) total eIF4E1 in pre-validated MNK2 shRNAs (black bar, TRCN0000342226 and white bar, TRCN0000006098) in Fig. 3a. Mean±s.d., n=3, *P-value of Student’s t-test <0.05. (f) Western blot showing total and phospho-eIF4E1(S209), MCL-1, eIF4E3 and MNK1 of HLY-1 cells 48 h post-transduction with a pre-validated MNK1 shRNA at MOI of 1 to 20. (gj) Densitometry analysis showing band intensity relative to GAPDH of (g) phospho-eIF4E1(S209), (h) MNK1, (i) MCL-1 and (j) total eIF4E1 in MNK1 shRNA transduction as in Fig. 3f. Mean±s.d., n=3, *P-value of Student’s t-test <0.05. (k,l) Western blot analysis of HLY-1 stable cell lines expressing MNK1 or MNK2, 48 h after transduction with non-target (NT) shRNA, (k) MNK2 shRNA (MNK2 KD) at MOI of 10, or (l) MNK1 shRNA (MNK1 KD) at MOI of 20. Densitometry analysis of Fig. 3k,l is shown in Supplementary Fig. 5a,b respectively. (m) Western blot showing MNK2 and total eIF4E1 in various cell lines 48 h post-transduction with MNK2 shRNA at MOI of 1 and 5. Densitometry analysis of Fig. 3m is in Supplementary Fig. 5c. (n) Top: western blot of HLY-1 cells treated with cycloheximide (100 μg ml−1) after MNK2 shRNA transduction at MOI of 10, compared with non-target shRNA (NT) control. Bottom: densitometry analysis of eIF4E1 protein level over time for non-target (NT, black squares) and MNK2 (grey squares) transduced HLY-1 cells. Values are mean±s.d., n=3, with logarithmic-fit curve (o) RT-qPCR analysis showing total eIF4E1 mRNA level relative to GAPDH expression in HLY-1 cells untreated (black triangles), and transduced with either non-target (red circles) or MNK2 shRNA (MNK2 KD, blue squares) viral particles, followed by actinomycin-D treatment (mean±s.d., n=3). (p) RT-qPCR analysis measuring eIF4E1 mRNA level in polysomal fractions, 48 h after knockdown by MNK1 or MNK2 shRNA (mean±s.d., n=3, *P-value of Student’s t-test <0.05). Full immunoblots are shown in Supplementary Fig. 10.
Figure 4
Figure 4. MNK kinase activity inhibition on eIF4E1 and eIF4E3.
(a) Western blot showing total and phospho-eIF4E1(S209), MCL-1 and eIF4E3 in HLY-1 and Pfeiffer DLBCL cell lines after 48 h treatment with MNK inhibitors, cercosporamide and CGP57380. (b) Densitometry analysis showing band intensity relative to GAPDH of phospho-eIF4E1(S209), total eIF4E1, MCL-1 and eIF4E3 proteins in Fig. 4a. Mean±s.e.m., n=3, *P-value of Student’s t-test <0.05. (c) Trypan blue exclusion assay of HLY-1 (black bars) and Pfeiffer (white bars) cells after 48 h treatment with vehicle, 5 μM cercosporamide or 20 μM CGP57380, and values normalized to vehicle. Mean±s.d., n=3, *P-value of Student’s t-test <0.05. (d) Western blot analysis following cap-pull down of HLY-1 and Pfeiffer cells following 48 and 72 h treatment with MNK inhibitors, probed for total eIF4E1. (e) Densitometry analysis showing band intensity relative to GAPDH of total eIF4E1 after 48 h (left panel) and 72 h (right panel) treatment with 5 μM cercosporamide or 20 μM CGP57380, as in Fig. 4d. Mean±s.e.m., n=3, *P-value of Student’s t-test <0.05. (f) RT-qPCR analysis measuring total eIF4E3 mRNA level in HLY-1 cells, 24 or 48 h after treatment with CGP57380 (20 μM). Values are mean±s.e.m., n=3, *P-value of Student’s t-test <0.05). (g) Western blot showing eIF4E3 level in HLY-1 cells after 48 h treatment with 20 μM CGP57380 and/or 100 μg ml−1 cycloheximide. (h) Densitometry analysis showing band intensity relative to GAPDH of eIF4E3 level in HLY-1 cells after 48 h treatment with 20 μM CGP57380 and 100 μg ml−1 cycloheximide, alone or in combination, as in Fig. 4f. Mean±s.e.m., n=3, *P-value of Student’s t-test <0.05. Full immunoblots are shown in Supplementary Fig. 10.
Figure 5
Figure 5. MNK kinase inhibition promotes the activity of an eIF4E3-defined eIF4F-3 translational complex.
(a) Western blot showing total and phospho-eIF4E1(S209) and total eIF4E3 in stable eIF4E1, eIF4E3 and MNK wildtype and mutant cell lines generated from HLY-1 parent cells. Note: eIF4E3-D199 mutant is detectable only with the N-terminal eIF4E3 antibody. FL=full length, S209D=phosphomimetic, S209A=phosphonull, D199=C-terminal truncation. (b) Densitometry analysis showing relative phospho-eIF4E1(S209) levels of eIF4E and MNK mutants as in Fig. 5a. Mean±s.e.m., n=3, *P-value of Student’s t-test <0.05. Note: a p-eIF4E1 antibody does not detect S209D or S209A mutations (c) Trypan blue exclusion assay showing growth curve of eIF4E mutants (left panel) and MNK mutants (right panel) shown in Fig. 5a. Values are mean±s.e.m., n=3, *P-value of Student’s t-test <0.05. (d) Stable HLY-1 cells expressing wild-type and mutant eIF4E1, eIF4E3 and MNKs were used for cap-pulldown and eIF4G-IP and probed for eIF4E1. (e) Densitometry analysis of total eIF4E1 after cap-pulldown (left panel) or eIF4G-IP (right panel) as in Fig. 5d normalized to empty vector (mean±s.e.m., n=3, *P-value of Student’s t-test <0.05). (f) Immunoblot following cap-pulldown showing eIF4E3 protein bound to cap in stable HLY-1 mutant cell lines. (g) Densitometry analysis of total eIF4E3 as in Fig. 5f, mean±s.e.m., n=3, *P-value of Student’s t-test <0.05. (h) Western blot following reciprocal IP in empty vector, eIF4E3 c-terminal truncated mutant (D199) and eIF4E3 wild type (FL) expressing HLY-1 cells (eIF4E3-IP probed for eIF4EG and eIF4A; eIF4G-IP probed for eIF4E3). (i) Western blot following cap-pulldown after vehicle (DMSO) or CGP57380 treatment for 24 h of wildtype and untreated eIF4E3 cells (j) Densitometry analysis of eIF4E3 in HLY-1 cells as in Fig. 5i, normalized to vehicle-treated wild-type cells. Values are mean±s.e.m., n=3, *P-value of Student’s t-test <0.05. (k) Cartoon illustrating polysomal fractionation by sucrose density gradient separation used in RNA and protein isolation for translatome analysis. (l) Western blot of sucrose density gradient fractions (k) probed for eIF4E3 and eIF4E1 (short and long exposure) of empty vector and eIF4E3 expressing HLY-1 mutant cells (left) and vehicle or CGP57380 treated cells (right). Blot shown is a representative of three independent experiments. Full immunoblots are shown in Supplementary Fig. 10.
Figure 6
Figure 6. Gene expression analysis of eIF4E1 and eIF4E3 translatome.
(a) Venn diagram illustrating the distribution of gene targets, which are either mutually or exclusively regulated by eIF4E1 and eIF4E3. (b,c) Heatmap depicting 50 top gene targets regulated by eIF4E1 (b) and eIF4E3 (c). Values depicted are Z-ratios of expression fold change in the translatome (TL) after eliminating changes in transcriptome (TR) in comparison with vector expressing HLY-1 cells that is, TL-TR data sets. Z-ratio values are as depicted in the colour scale shown. (d) Principal component analysis showing data distribution of each data subset that is, eIF4E1-translatome (E1TL, blue), eIF4E3-translatome (E3TL, green), empty vector-translatome (EVTL, brown), eIF4E1-transcriptome (E1TR, red), eIF4E3-transcriptome (E3TR, purple) and empty vector-transcriptome (EVTR, turquoise). (e) IPA core molecular network analysis of significantly upregulated genes in eIF4E1 translatome exhibiting molecular network interactions that focused on NF-κB complex as a major node. (f) IPA core analysis of significantly upregulated genes in eIF4E3 translatome displayed molecular network interactions that showed several diffused nodes leading to downregulation of DICER1 and upregulation of n-Myc. Details of all the bioinformatics analyses performed and the statistical tests used are described in the methods section of Microarray analysis. (g) Western blot showing the protein expression of DICER1, n-Myc and c-Myc in vector control, eIF4E1 and eIF4E3 expressing HLY-1 cells. (h) Western blot showing three NF-κB targets, YY1, BTK and CDK6 in HLY-1 cells either overexpressing eIF4E1 or treated with eIF4E1 shRNA to knockdown eIF4E1 expression. Full immunoblots are shown in Supplementary Fig. 10.
Figure 7
Figure 7. eIF4E1- and eIF4E3-translatome selective 5′-UTR motifs.
(a) eIF4E1-driven 5′-UTR motif sequence #1, with motif location map illustrating the location of motif #1 (blue) and #2 (cyan) in the 5′-UTR region and RT-qPCR validation of target genes representing motif #1 target, DTD1. mRNA percentage was normalized to exogenous luciferase control mRNA level (eIF4E1 in blue and eIF4E3 in red). Values shown represent mean±s.e.m., n=3, *P-value of Student’s t-test <0.05. (b) eIF4E1-driven 5′-UTR motif sequence #2, with motif location map illustrating the location of motif #2 (blue) and #1 (pink) in the 5′-UTR region and RT-qPCR validation of target genes representing motif #2 target, DGCR6. mRNA percentage was normalized to exogenous luciferase control mRNA level (eIF4E1 in blue and eIF4E3 in red). Values shown represent mean±s.e.m., n=3, *P-value of Student’s t-test <0.05. (c) eIF4E3-driven 5′-UTR motif sequence #1, with motif location map illustrating the location of motif #1 (red) and #2 (blue) in the 5′-UTR region and RT-qPCR validation of target genes representing motif #1 target, POLA2. mRNA percentage was normalized to exogenous luciferase control mRNA level (eIF4E1 in blue and eIF4E3 in red). Values shown represent mean±s.e.m., n=3, *P-value of Student’s t-test <0.05. (d) eIF4E3-driven 5′-UTR motif sequence #2, with motif location map illustrating the location of motif #2 (blue) and #1 (red) in the 5′-UTR region and RT-qPCR validation of target genes representing motif #2 target, DDX49. mRNA percentage was normalized to exogenous luciferase control mRNA level (eIF4E1 in blue and eIF4E3 in red). Values shown represent mean±s.e.m., n=3, *P-value of student t-test <0.05.
Figure 8
Figure 8. The regulation of eIF4E1 and eIF4E3 by MNKs in DLBCL.
(a) On activation by p38, MNKs phosphorylate eIF4E1 at S209. (b) In the absence of MNK kinase activity, eIF4E1 cannot be phosphorylated, while in the (c) absence of MNK protein expression or its physical suppression, eIF4E1 protein expression is downregulated. (d) The unphosphorylated eIF4E1 (at S209) form is stimulatory for eIF4E3 protein upregulation. Increased abundance of eIF4E3 in a cellular context enhances the ability for eIF4E3 to bind cap. The relative abundance of either eIF4E1 or eIF4E3 is determined by MNKs. The accessibility to mRNA cap structure by both eIF4Es mandates a distinct cellular translatome that dictates pro- or anti-oncogenic phenotype.

Similar articles

Cited by

References

    1. Hershey J. W., Sonenberg N. & Mathews M. B. Principles of translational control: An overview. Cold Spring Harb. Perspect. Biol. 4, (2012). - PMC - PubMed
    1. Ruggero D. Translational control in cancer etiology. Cold Spring Harb. Perspect. Biol. 5, (2013). - PMC - PubMed
    1. Ruggero D. et al. The translation factor eIF-4E promotes tumor formation and cooperates with c-myc in lymphomagenesis. Nat. Med. 10, 484–486 (2004). - PubMed
    1. Gingras A. C., Raught B. & Sonenberg N. eIF4 initiation factors: Effectors of mRNA recruitment to ribosomes and regulators of translation. Annu. Rev. Biochem. 68, 913–963 (1999). - PubMed
    1. Sonenberg N., Morgan M. A., Merrick W. C. & Shatkin A. J. A polypeptide in eukaryotic initiation factors that crosslinks specifically to the 5′-terminal cap in mRNA. Proc. Natl Acad. Sci. USA 75, 4843–4847 (1978). - PMC - PubMed

Publication types

MeSH terms

Substances

Associated data