. 2014 Nov 10:5:5362.
doi: 10.1038/ncomms6362.

PARP13 regulates cellular mRNA post-transcriptionally and functions as a pro-apoptotic factor by destabilizing TRAILR4 transcript

Affiliations

PARP13 regulates cellular mRNA post-transcriptionally and functions as a pro-apoptotic factor by destabilizing TRAILR4 transcript

Tanya Todorova et al. Nat Commun. .

Abstract

Poly(ADP-ribose) polymerase-13 (PARP13/ZAP/ZC3HAV1) is an antiviral factor, active against specific RNA viruses such as murine leukaemia virus, Sindbis virus and human immunodeficiency virus. During infection, PARP13 binds viral RNA via its four CCCH-type zinc-finger domains and targets it for degradation by recruiting cellular messenger RNA (mRNA) decay factors such as the exosome complex and XRN1. Here we show that PARP13 binds to and regulates cellular mRNAs in the absence of viral infection. Knockdown of PARP13 results in the misregulation of hundreds of transcripts. Among the most upregulated transcripts is TRAILR4 that encodes a decoy receptor for TRAIL-a pro-apoptotic cytokine that is a promising target for the therapeutic inhibition of cancers. PARP13 destabilizes TRAILR4 mRNA post-transcriptionally in an exosome-dependent manner by binding to a region in its 3' untranslated region. As a consequence, PARP13 represses TRAILR4 expression and increases cell sensitivity to TRAIL-mediated apoptosis, acting as a key regulator of the cellular response to TRAIL.


Figures
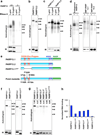
Figure 1
Figure 1. PARP13 binds cellular RNA
a, Autoradiogram of PARP13 CLIP reactions performed using wild type (+/+) or PARP13-null (−/−) cells treated with 1µg/ml or 0.13µg/ml RNaseA. Triangle indicates molecular weight (MW) of PARP13.1, circle indicates MW of PARP13.2. PARP13 immunoblot (IB) shown below. b, Autoradiogram of CLIP reactions from SBP-PARP13.1 and PARP13.2 expressed and purified in wild type cells treated with 1µg/ml RNaseA. PARP13 immunoblots shown below. c, Autoradiogram of SBP-PARP13.1 and SBP-PARP13.2 CLIP reactions treated with 1µg/ml or 0.1µg/ml RNase A. PARP13 immunoblots are shown below. d, CLIP autoradiograms of endogenous PARP13, SBP-PARP13.1 and SBP-PARP13.2 treated with 1µg/ml RNase A with or without UV crosslinking (254nm, 200mJ). PARP13 immunoblots shown below. e, Diagram of PARP13 isoforms and mutants. f, CLIP autoradiograms of SBP-PARP13.1, PARP13.1ΔZnF, PARP13.2 and PARP13.2ΔZnF precipitations treated with 1µg/ml RNase A. PARP13 immunoblot shown below. g, Autoradiogram of wild type and mutant PARP13.1 CLIP reactions. PARP13 immunoblot shown below (IB). Numerical values of 32P signal normalized to protein levels shown above; PARP13.1 RNA binding levels set to 1. h, Graph of 32P signals normalized to PARP13.1 protein levels for CLIP analysis shown in Fig. 1g.
Figure 2
Figure 2. Localization of PARP13.1, PARP13.2 and RNA binding mutants
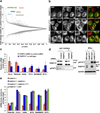
a, Immunofluorescence showing co-staining of exogenously expressed PARP13.1, PARP13.1ΔZnF, PARP13.1VYFHR, PARP13.2, PARP13.2ΔZnF or PARP13.2VYFHR in non-stressed (No Treatment) and stressed (200µM Sodium Arsenite) cells. Scale Bar = 20µm.
Figure 3
Figure 3. PARP13 depletion results in misregulation of the transcriptome
a, Volcano plot showing transcriptome-wide Log2 fold changes in mRNA expression in PARP13 knockdowns relative to control knockdowns obtained via Agilent array analysis of total mRNA (n=2 independent experiments). 6 of the Top 10 upregulated transcripts are labeled. The remaining mRNA data shown in the figure were obtained using qRT-PCR. b, Immunofluorescence of cell expressing SBP-PARP13.1, SBP-PARP13.1VYFHR or SBP-PARP13.2, stained with anti-PARP13 and anti-SBP antibodies, and ER Tracker Red. In merge SBP signal is in green, ER Tracker signal is in red, PARP13 signal is not shown. Scale bar = 20µm. c, Confirmation of CCL5, TRAILR4, OASL, IFIT2, RARRES3 and IFIT3 upregulation in PARP13 knockdown relative to control knockdown and in PARP13−/−A HeLa cells relative to wild type cells (n=3 independent experiments, bars represent SD) d, Left, Immunoblots of PARP13 and pSTAT1 in untransfected cells, or cells transfected with control or PARP13-specific siRNA, untreated or treated with 5µM Jak1 inhibitor; right, immunoblots of PARP13 and pSTAT1 in wild type and PARP13−/− HeLa cells untreated or treated with 100units/ml IFNγ. GAPDH shown as loading control. e, mRNA levels of TRAILR4, CCL5, OASL, IFIT2, RARRES3 and IFIT3 in untransfected PARP13−/− cells and PARP13−/− cells expressing PARP13.1, PARP13.1VYFHR or GFP (DNA transfection control) relative to HeLa cells (n=3 independent experiments, bars represent SD).
Figure 4
Figure 4. PARP13 repression of TRAILR4 mRNA and protein levels is dependent on its RNA binding
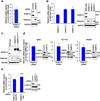
a, TRAILR4 mRNA and protein levels in PARP13 knockdown relative to control. GAPDH shown as loading control. n=3 independent experiments, error bars show SD. b, TRAILR4 mRNA and protein levels in PARP13−/− cell lines relative to wild type cells. GAPDH shown as loading control. n=3 independent experiments, error bars show SD. c, TRAILR4 protein levels in wild type, PARP13−/−A, and PARP13−/−A cells expressing PARP13.1 or PARP13.1VYFHR. GAPDH shown as a loading control. d, TRAILR4 mRNA levels (Log2FC) in PARP13 knockdown relative to control knockdown in RPE1, SW480 and HCT116 cells (averages of n=3 parallel reactions (RPE1) or n=3 independent experiments (SW480 and HCT116) shown, error bars show SD). Immunoblots show PARP13 knockdown; GAPDH shown as normalizing control. e, TRAILR4 mRNA levels in cells treated with PARP13.1-specific and total PARP13 specific siRNAs relative to control siRNAs (averages of n=3 independent experiments shown, error bars show SD, p>0.05 (n.s.), two-sided t-test comparing the two knockdowns). Immunoblots show PARP13.1 depletion upon knockdown with PARP13.1 specific siRNA. GAPDH shown as loading control.
Figure 5
Figure 5. PARP13 represses TRAILR4 mRNA posttranscriptionally by binding to a specific region in its 3’UTR
All RNA quantitation performed using qRT-PCR a, TRAILR4 mature RNA (Exon1/Exon3 primer) and pre-mRNA (Intron6-Exon7, Intron 8/Exon9 primers) levels in PARP13 knockdown relative to control knockdown (mean of n=3 independent experiments, error bars show SD). b, Normalized Renilla/Firefly luminescence for psiCHECK2 empty vector, psiCHECK2 expressing Renilla-GAPDH 3’UTR (GAPDH 3’UTR), and psiCHECK2 expressing Renilla-TRAILR4 3’UTR (TRAILR4 3’UTR) expressed in wild type or PARP13−/−A cells (mean of n=3 independent experiments, error bars represent SD, p<0.01 (**), two sided t-test). c, Left top, diagram of Renilla-TRAILR4 3’UTR construct identifying AU-rich element (ARE), ZAP responsive element (ZRE), and miRNA binding sites for miR-133; triangle shading indicates relative length of motif- darker shades correspond to longer motifs. Specific ARE sequences and locations are shown in Supplementary Fig. 5. Left bottom, fragments used in 3’UTR destabilization assay. Blue fragments exhibited PARP13-dependent destabilization whereas red fragments were not regulated. Right, relative PARP13-dependent destabilization for each 3’UTR fragment, represented by fraction increase of normalized Renilla luminescence in PARP13−/−A cells relative to wild type cells, (means of n=3 independent experiments, error bars show SD, asterisks represent significance relative to empty vector, p<0.05 (*), p<0.01(**) and p<0.001 (***), two-sided t-test) d, Fold enrichment (Log2) of TRAILR4 mRNA in input and bound fraction in PARP13.1 CLIP reactions relative to PARP13.1VYFHR reactions (mean of n=3 independent experiments, error bars show SD, p<0.01 (**), two-sided t-test). PARP13 immunoblot shows precipitated protein levels. e, Relative log2 levels of TRAILR4 mRNA in input and bound fractions in PARP13.1 CLIP reactions relative to PARP13.1ΔZnF reactions (averages of n=3 independent experiments, bars show SD, p<0.05 (*) relative to PARP13.1ΔZnF, two-sided t-test). PARP13 Immunoblot of precipitated protein shown at right. f, Electrophoretic Mobility Shift Assays (EMSA) of decreasing amounts of PARP13.1 and PARP13.1VYFHR (from 533nM to 71nM, in 25% interval decrease) with radiolabeled Fragment E and Fragment 1 (experiment was repeated 3 times with similar results). Right, Coomassie stain showing equal protein concentration of PARP13.1 and PARP13.1VYFHR.
Figure 6
Figure 6. PARP13 destabilization of TRAILR4 mRNA is exosome dependent
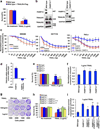
a, TRAILR4 mRNA levels in EXOSC5 and XRN1 knockdowns relative to control knockdown (means of n=3 independent experiments, bars show SD, asterisks represent significance relative to control siRNA, p<0.05 (*), p>0.05 (n.s.), two-sided t-test). b, Left, EXOSC5 mRNA levels in EXOSC5 knockdown relative to control knockdown (bars show SD, n=3 independent experiments); right, immunoblot showing XRN1 protein levels in control and XRN1 knockdown. GAPDH is shown as loading control. c, Relative TRAILR4 mRNA levels in Tet-treated or untreated HEK293 cells expressing Tet-inducible Ago2 shRNA, treated with control or PARP13-specific siRNA (averages of n=3 parallel reactions, error bars show SD). Immunoblots of PARP13, Ago2 and GAPDH (loading control) shown at right. d, Bar graphs showing normalized Renilla luminescence for empty vector and Renilla-TRAILR4 3’UTR, expressed in wild type (red) or PARP13−/−A cells (blue) treated with control siRNA or siRNA specific for EXOSC5 or XRN1. PARP13-dependent destabilization levels, calculated by substracting normalized Renilla luminescence signal in wild type cells from signal in PARP13−/−cells, is shown at left of the bars. (means of n=3 independent replicates, bars show SD, asterisks represent significance relative to control siRNA destabilization levels, p<0.001(***), p>0.05 (n.s). e, Decay of GAPDH mRNA and TRAILR4 mRNA is wild type and PARP13−/−cells measured by qRT-PCR of 4-thiouridine incorporated and purified RNA. At each time point GAPDH and TRAILR4 levels were normalized to ACTB levels. Levels at Time 0 were set as 0. (means of n=3 independent experiments, error bars show SD, asterisks represent significance relative to wild type levels for each time point, p<0.05(*), p<0.01(**), two-sided t-test).
Figure 7
Figure 7. PARP13 depletion results in resistance to TRAIL-mediated apoptosis
a, Percent survival of untreated and TRAIL treated wild type cells and wild type cells expressing TRAILR4-Flag assayed via Annexin-V/PI FACS (average of n=3 independent experiments, bars represent SEM, p<0.05(*), two-sided t-test). b, Immunoblot of TRAILR1-2 and TRAILR4 proteins in wild type and PARP13−/−A cells. GAPDH is used as loading control. c, Survival assay measuring proliferation of SW480, HCT116 and HeLa cells with or without PARP13 knockdown after treatment with increasing concentrations of TRAIL for 24 h. Results are shown relative to untreated cells (means of n=3 independent experiments, error bars show SEM). Results for double knockdown of TRAILR4 and PARP13 are shown for HeLa cells. d, TRAILR4 mRNA levels after PARP13 and PARP13+TRAILR4 knockdown relative to control knockdown (averages of n=3 independent experiments, error bars show SD). e, Annexin-V/PI apoptosis assays comparing the percent survival of wild type and three independent PARP13−/− cell lines (A, B, C) upon 1 µg/ml TRAIL treatment for 24 h (n=3 independent experiments, bars show SEM, asterisks show significance relative to wild type, p<0.001 (***), two-sided t-test) f, Normalized survival of wild type and three PARP13−/− cell lines treated with 1µg/ml TRAIL relative to untreated (averages of n=3 independent experiments, bars show SEM, asterisks show significance relative to wild type, p<0.05 (*) or p<0.01(**), two-sided t-test). g, Colony formation assay measured by crystal violet staining of wild type or PARP13−/−A cells treated with or without the indicated amounts of TRAIL for 7 days. h, Annexin-V/PI apoptosis assays comparing the percent survival of wild type, PARP13−/−A or PARP13−/−A cells expressing PARP13.1, PARP13.1VYFHR or PARP13.1ΔZnF upon treatment with or without 1 µg/ml TRAIL for 24 h. Data is shown as % survival (means of n=3 independent experiments, bars show SEM, asterisks show significance relative to wild type, p<0.05 (*), p<0.01(**), p>0.05 (n.s.), two-sided t-test). i, Normalized survival of wild type, PARP13−/−A cells and PARP13−/−A cells expressing PARP13.1, PARP13.1VYFHR or PARP13.1ΔZnF treated with 1µg/ml TRAIL relative to untreated (n=3 independent experiments, bars show SEM, asterisks represent significance relative to wild type, p<0.05 (*), p<0.01(**), p<0.001(***), two-sided t-test).
Figure 8
Figure 8. PARP13 depletion inhibits the formation of a functional DISC complex
a, Immunoblot examining caspase-8 cleavage at various time points after 1 µg/ml TRAIL treatment in wild type and PARP13−/− cells. Arrows indicate full-length (FL) caspase-8 and its cleavage products. GAPDH shown as loading control. b, Flag-TRAIL pulldown of the TRAIL-receptor complex in wild type and PARP13−/−A cells blotted for TRAILR1, R2 and caspase-8. Inputs for the reaction are also shown. c, Model of PARP13 dependent TRAILR4 mRNA regulation and its effects on TRAIL mediated apoptosis.

Similar articles

Cited by

References

    1. Vyas S, Chesarone-Cataldo M, Todorova T, Huang YH, Chang P. A systematic analysis of the PARP protein family identifies new functions critical for cell physiology. Nature communications. 2013;4:2240. - PMC - PubMed
    1. Charron G, Li MM, MacDonald MR, Hang HC. Prenylome profiling reveals S-farnesylation is crucial for membrane targeting and antiviral activity of ZAP long-isoform. Proceedings of the National Academy of Sciences of the United States of America. 2013;110:11085–11090. - PMC - PubMed
    1. Gao G, Guo X, Goff SP. Inhibition of retroviral RNA production by ZAP, a CCCH-type zinc finger protein. Science. 2002;297:1703–1706. - PubMed
    1. Brooks SA, Blackshear PJ. Tristetraprolin (TTP): interactions with mRNA and proteins, and current thoughts on mechanisms of action. Biochimica et biophysica acta. 2013;1829:666–679. - PMC - PubMed
    1. Fernandez-Costa JM, Llamusi MB, Garcia-Lopez A, Artero R. Alternative splicing regulation by Muscleblind proteins: from development to disease. Biological reviews of the Cambridge Philosophical Society. 2011;86:947–958. - PubMed

Publication types

MeSH terms

Associated data