. 2014 Nov 10:5:5286.
doi: 10.1038/ncomms6286.

High-resolution structure and mechanism of an F/V-hybrid rotor ring in a Na⁺-coupled ATP synthase

Affiliations

High-resolution structure and mechanism of an F/V-hybrid rotor ring in a Na⁺-coupled ATP synthase

Doreen Matthies et al. Nat Commun. .

Abstract

All rotary ATPases catalyse the interconversion of ATP and ADP-Pi through a mechanism that is coupled to the transmembrane flow of H(+) or Na(+). Physiologically, however, F/A-type enzymes specialize in ATP synthesis driven by downhill ion diffusion, while eukaryotic V-type ATPases function as ion pumps. To begin to rationalize the molecular basis for this functional differentiation, we solved the crystal structure of the Na(+)-driven membrane rotor of the Acetobacterium woodii ATP synthase, at 2.1 Å resolution. Unlike known structures, this rotor ring is a 9:1 heteromer of F- and V-type c-subunits and therefore features a hybrid configuration of ion-binding sites along its circumference. Molecular and kinetic simulations are used to dissect the mechanisms of Na(+) recognition and rotation of this c-ring, and to explain the functional implications of the V-type c-subunit. These structural and mechanistic insights indicate an evolutionary path between synthases and pumps involving adaptations in the rotor ring.


Conflict of interest statement

Competing Financial Interests Statement

The authors declare no competing financial interests.

Figures
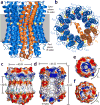
Figure 1
Figure 1
Structure of the heteromeric c-ring from the Acetobacterium woodii ATP synthase. The ring is viewed (a) along the membrane plane and (b) from the periplasm, highlighting the two c-subunit topologies (blue and orange cartoons), as well as the bound Na+ ions (yellow spheres) and the co-coordinating water molecules (red spheres). Note the site within subunit c1 does not bind Na+. Residues L55/F77 in c2/3, and L72/L155/F94/Y177 in c1 indicate the likely position of the ring within the membrane (gray). (c) Electrostatic potential at the outer surface of the c-ring, and (d) at the surface of the central hydrophobic pore. Detergent molecules (green) resolved in the electron density map are highlighted. Arrows indicate the position of the ion-binding sites. (e) Asymmetry of the electrostatic potential on the cytoplasmic face of the c-ring, where the central stalk binds. (f) The N-terminal extension of subunit c1 occludes the central pore almost completely.
Figure 2
Figure 2
Configuration of ion-binding sites in the A. woodii c-ring. (a) One of the eight Na+-binding sites at the interfaces between c2/3 subunits, viewed from the membrane. The protein residues (gray sticks) and water molecule (red sphere) coordinating the ion (yellow sphere) are highlighted. (b The Na+-binding site at the c2/3/c1 interface. (c) The water-binding site within the c1 subunit. (d) The Na+-binding site at the c1/c2/3 interface. Dashed lines indicate inferred hydrogen-bonds in (a) and (c), and ion-protein contacts in (b) and (d). (e) Fo−Fc difference map (green mesh) for all bound Na+ and water molecules, contoured at +5.0σ. The ring is viewed from the cytoplasmic side. (f) Fo−Fc maps for either Na+ or water molecules (yellow and green mesh, respectively) bound within c1 and the c1/c2/3 interface, contoured at +4.0σ. The 2Fo−Fc map for the protein is also shown, contoured at 2.4σ (light blue mesh). Supplementary Fig. 6 shows a stereo-view of this figure.
Figure 3
Figure 3
High-resolution AFM of the A. woodii c-ring. (a) Topograph of A. woodii c-rings densely reconstituted in a lipid membrane, with kind permission from the publisher). (b) Representative class-average of the periplasmic face of the c-ring, from single-particle analysis (see also Supplementary Fig. 7). (c) Density data calculated from (b), colored according to height. (d) Same data as in (c), viewed diagonally and in cross-section. (e) Same data as in (c) contoured and overlaid on the molecular surface of the c-ring. The position of subunit c1 is indicated.
Figure 4
Figure 4
Spontaneous unbinding and rebinding of Na+ from/to the A. woodii c-ring in molecular dynamics simulations. (a) Time-series of the distance between each of the ten Na+ ions bound to the A. woodii c-ring and the neighboring inner helix (residue Pro25 in c2/3 subunits, or Pro42 in c1), in three independent simulations in which the ring is either embedded in a phospholipid membrane (Supplementary Fig. 8), or solubilized in 30% MPD/water (Supplementary Figs. 8, 9) (two simulations), representing the two different micro-environments of the ion-binding sites as the c-ring rotates against subunit-a. The time-trace for each ion is colored differently. (b) Representative simulation snapshots during the unbinding (upper panels) and rebinding reactions (lower panels) reveal the atomic mechanism of Na+ recognition and release. The time-stamp for each snapshot is indicated. Note that the configuration of the unbound site prior to Na+ rebinding is uncorrelated from that immediately after Na+ release (Supplementary Fig. 9). The c-ring is colored as in Fig. 1. Side-chains and water molecules (sticks and red spheres, respectively) coordinating Na+ (yellow spheres) are highlighted. Hydrogen atoms, other protein side-chains and buffer molecules are omitted for clarity.
Figure 5
Figure 5
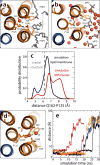
Dynamics of the vacant site in the V-type c1 subunit. (a) Close-up of the c1 site, viewed from the cytoplasm, in a representative snapshot of the simulation of the c-ring in a phospholipid membrane (Supplementary Fig. 7). The configuration closely resembles the locked conformation observed in the crystal structure of the c-ring in detergent. (b) Close-up of the c1 site in a representative snapshot of the simulation of the c-ring in the MPD/water buffer (Supplementary Figs. 7, 8). Polar interactions with the buffer unlock the H-bonding interaction network within the site, allowing Gln162 to project away into the solvent. The c-ring is represented as in Fig. 1. Side-chains and water molecules in the site, as well as neighboring lipid tails or MPD molecules, are highlighted (sticks, spheres). Hydrogen atoms as well as other protein side-chains and lipid head-groups are omitted for clarity. (c) Probability distributions of the distance between the carboxamide group of Gln162 and Pro125, in the neighboring inner helix, in either simulation, demonstrate the propensity of the c1 site to adopt an open conformation in the hydrated environment. (d) Hypothetical configuration of the c1 site with a bound Na+, equilibrated through restrained molecular dynamics simulations. Note the ion is penta-coordinated, as in the actual Na+-binding sites. (e) Rapid, spontaneous dissociation of the Na+ ion modeled in the c1 site in 5 independent simulation trajectories.
Figure 6
Figure 6
Proposed microscopic mechanism of c-ring rotation coupled to ion transport. The diagram shows the interface between the c-ring, represented by five of the outer helices (blue circles), and subunit-a, in the topology of TM2-TM5 (white circles) predicted by cross-linking data. Two aqueous half-channels mediate ion exchange across the a/c complex with either the P-side (outside) or the N-side (inside) of the energized membrane (black dashed lines). Hydration of the c-ring binding sites (SP and SN, respectively) facilitates loading and release of ions (yellow spheres) via isomerization of a conserved glutamate/aspartate (E, red sticks). A conserved arginine in subunit-a (R, blue sticks) forms alternating salt-bridges with SP and SN and thus prevents the ion from hopping between these sites, i.e. it effectively provides an electrostatic barrier between the P and N-channels. The directionality of the mechanism is thus imposed by the clockwise arrangement of SP and SN sites: downhill ion permeation (i.e. from P to N) necessarily implies counter-clockwise c-ring rotations (powering ATP synthesis), while clockwise rotations (driven by ATP hydrolysis) imply uphill transport (i.e. from N to P).
Figure 7
Figure 7
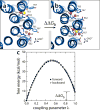
Electrostatic barrier between the P and N-channels. (a) A snapshot was extracted from one of the simulations in which Na+ is spontaneously released (Fig. 5), and the exposed glutamate side-chain was paired to a guanidinium ion (GND+), modeled in to represent the interaction with the key arginine side-chain on TM4 of subunit-a. (b) The free-energy cost of transferring a bound Na+ from the adjacent site, counter-clockwise, to the site engaged to the GND+ ion, was then computed, by gradually decoupling the ion from its environment in configuration (a) and re-coupling it in configuration (b). (c) Free-energy change as a function of the (de)coupling parameter λ. The transfer free energy was calculated in both directions. The c-ring is represented as in Fig. 1. Side-chains and water molecules in the site are highlighted (sticks, spheres). Hydrogen atoms as well as other protein side-chains and all MPD/water molecules are omitted for clarity.
Figure 8
Figure 8
Energetics of exchange of sequential subunit-a/subunit-c interactions in the rotary cycle. The interaction of the c-subunits with the key arginine on subunit-a was again mimicked with a GND+ ion (gray/blue sticks) added to the MPD/water buffer. (a) GND+ exchange between two unlocked glutamate side-chains (blue sticks) in adjacent Na+-binding sites, i.e. after Na+ release from the SN site and prior to Na+ loading to the SP site. The three panels on the left depict the end-point states in the exchange, and the transition state in between. The colored volumes are density maps extracted from the simulations, mapping the location of either GND+ (blue), the first hydration shell of GND+ (red), or the first hydration shell of the carboxylate groups (white). Representative snapshots are shown in Supplementary Fig. 11. The panel on the right shows the free-energy profile associated with the exchange, as a function of the distances between the GND+ ion and SP and SN (dP and dN). A two-dimensional free-energy surface is shown in Supplementary Fig. 11. (b) Exchange between the unlocked glutamine side-chain in the c1 subunit (orange sticks) and the glutamate side-chain in the adjacent Na+ site, counter-clockwise. (c) Same as (b), clockwise. The c-ring is represented as in Fig. 2. Hydrogen atoms as well as protein side-chains and MPD/water molecules are omitted for clarity.
Figure 9
Figure 9
Thermodynamic impact of the c1 subunit on ATP synthesis and ion transport. (a) Hypothetical free-energy profiles of the c-ring/subunit-a complex, coupled to F1, for a prototypical F-type c11-ring with no missing ion-binding sites, and for the A. woodii c-ring. The profiles illustrate the microscopic states, free-energy differences and kinetic barriers employed in the kinetic model of the rotational cycle described in the text. These states are individually identified by the configuration of the SP and SN sites, i.e. whether they feature a glutamate (E) or glutamine (Q), whether they are occupied by Na+ (E+) or not (E, Q), and whether they are paired with the arginine on subunit-a (ER, QR) (Methods). The profiles shown represent an equilibrium condition in which the sodium-motive force (blue arrow) and the phosphorylation potential (red arrow) are exactly balanced. The simulations are, however, initiated out of equilibrium, i.e. the landscapes are heavily tilted in one or other direction, favoring ion-driven ATP synthesis or ATP-driven uphill transport, reaching equilibrium gradually. (b) Production of ATP driven by a variable transmembrane Na+ gradient (30-fold initially), under a constant membrane potential of 180 mV i.e. mimicking a voltage-clamp electrophysiological experiment in which the potential is set with K+ and valinomycin. The values of [ATP], [Na+]P and [Na+]N at equilibrium are compared with those set initially; percentage differences between the values calculated for an ATP synthase with a prototypical c11 ring and the A. woodii enzyme are indicated. (c) Generation of a transmembrane Na+ gradient, under a constant membrane potential of 0 mV, driven by an excess of ATP over ADP and Pi. Equilibrium values for a prototypical c11 ring and that in A. woodii are again compared. (d) Initial rotation rates under the same conditions used in (b) and (c). The data are averages over 100 independent kinetic Monte-Carlo trajectories of 20 million steps each (Supplementary Fig. 13).

Similar articles

Cited by

References

    1. Junge W, Nelson N. Nature’s rotary electromotors. Science. 2005;308:642–644. - PubMed
    1. Fillingame RH. Coupling H+ transport and ATP synthesis in F1Fo-ATP synthases: glimpses of interacting parts in a dynamic molecular machine. J Exp Biol. 1997;200:217–224. - PubMed
    1. Rocha-Facanha A, de Meis L. Reversibility of H+-ATPase and H+-pyrophosphatase in tonoplast vesicles from maize coleoptiles and seeds. Plant Physiol. 1998;116:1487–1495. - PMC - PubMed
    1. Hirata T, Nakamura N, Omote H, Wada Y, Futai M. Regulation and reversibility of vacuolar H+-ATPase. J Biol Chem. 2000;275:386–389. - PubMed
    1. Pogoryelov D, et al. Engineering rotor ring stoichiometries in the ATP synthase. Proc Natl Acad Sci USA. 2012;109:E1599–1608. - PMC - PubMed

Publication types

MeSH terms

Associated data

LinkOut - more resources