. 2015 Jan 1;128(1):118-28.
doi: 10.1242/jcs.157495. Epub 2014 Nov 6.

EFR3s are palmitoylated plasma membrane proteins that control responsiveness to G-protein-coupled receptors

Affiliations

EFR3s are palmitoylated plasma membrane proteins that control responsiveness to G-protein-coupled receptors

Naveen Bojjireddy et al. J Cell Sci. .

Abstract

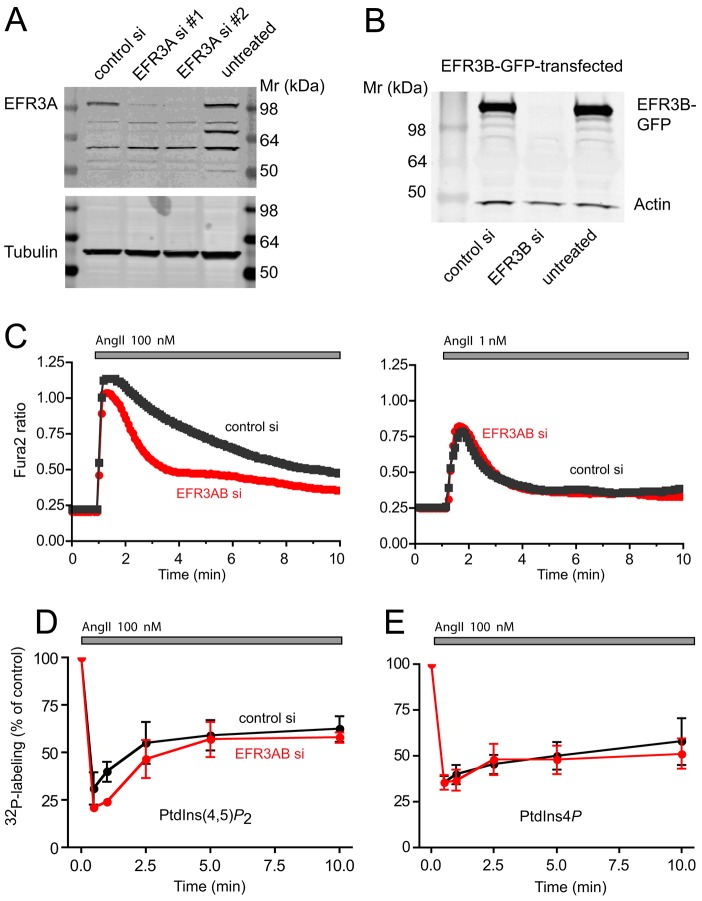
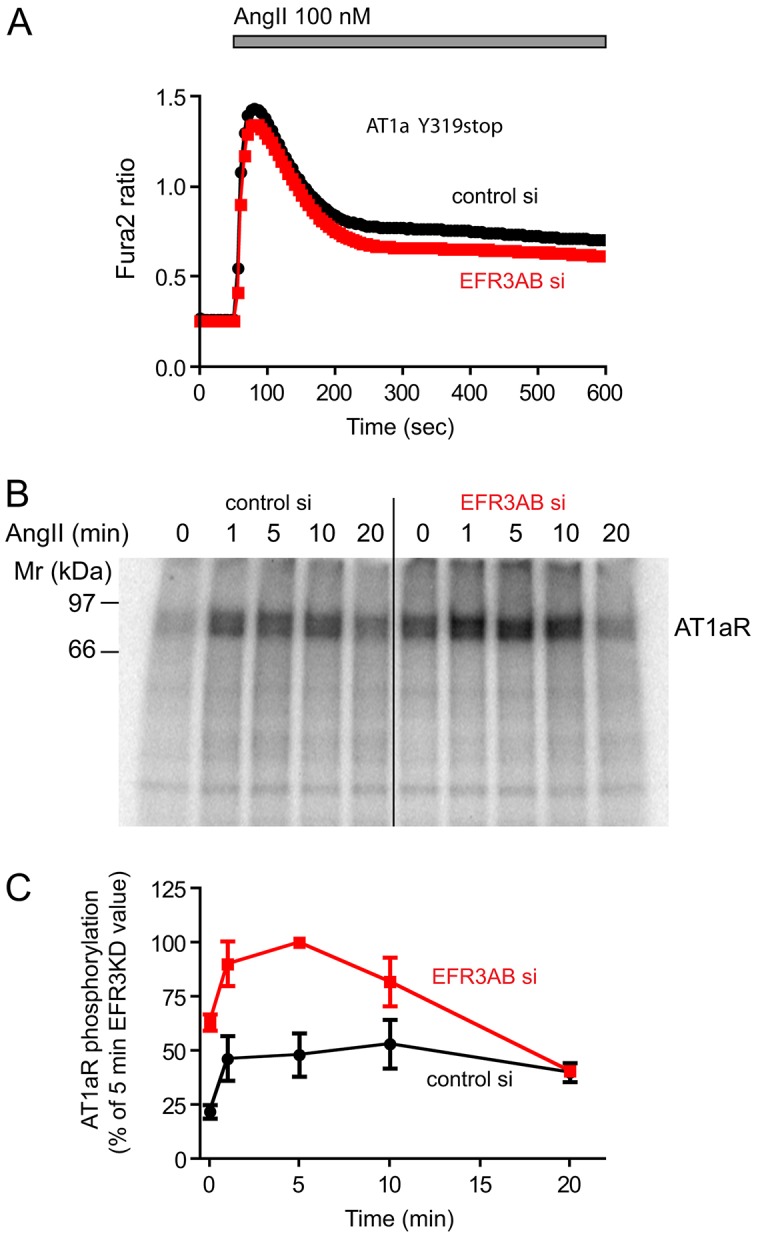
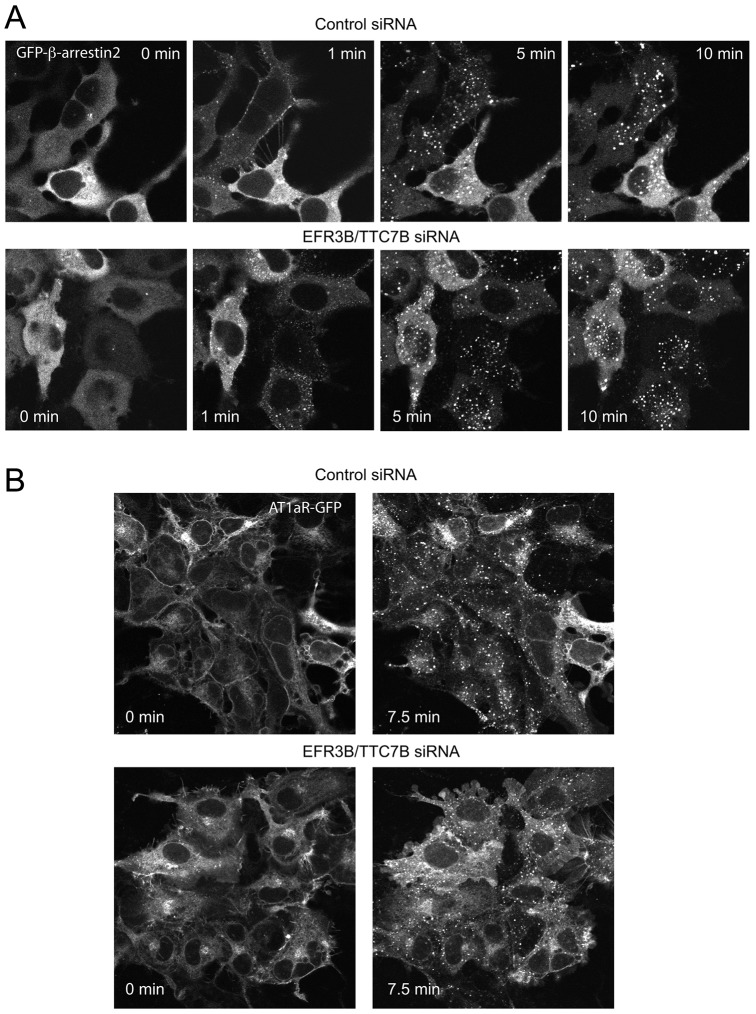
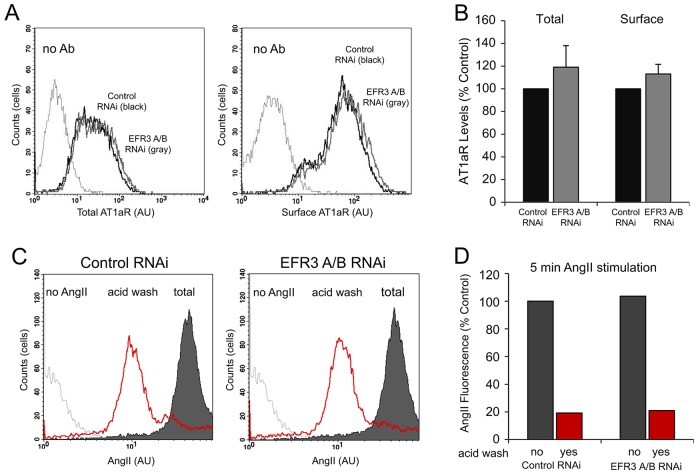
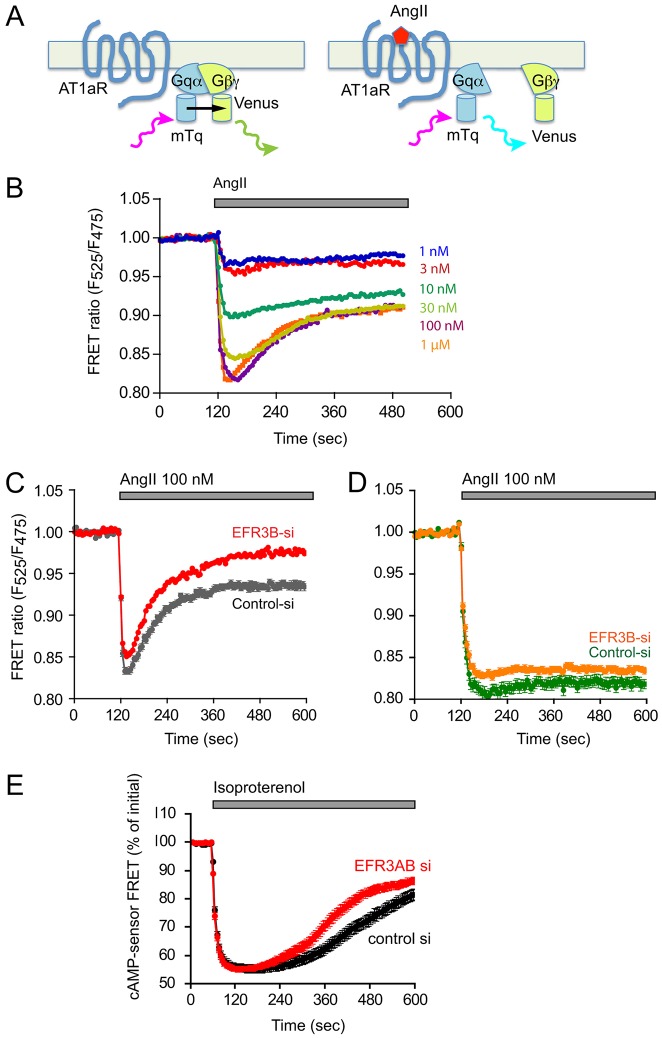
The yeast Efr3p protein is a main regulator of the Stt4p phosphatidylinositol 4-kinase at contact sites between the endoplasmic reticulum and the plasma membrane. A mutation in its fly homologue Rbo, leads to diminished light responses in the eye attributed to progressively impaired PLC signaling. Here, we find that Efr3s plays a role in maintaining responsiveness to the type-I angiotensin II (AngII) receptors. siRNA-mediated depletion of EFR3A and EFR3B impaired the sustained phase of cytosolic Ca(2+) response to high concentration of AngII in HEK293 cells that express wild type but not truncated AGTR1 (AT1a receptor), missing the phosphorylation sites. Efr3 depletion had minimal effect on the recovery of plasma membrane phosphoinositides during stimulation, and AT1 receptors still underwent ligand-induced internalization. A higher level of basal receptor phosphorylation and a larger response was observed after stimulation. Moreover, Gq activation more rapidly desensitized after AngII stimulation in Efr3 downregulated cells. A similar but less pronounced effect of EFR3 depletion was observed on the desensitization of the cAMP response after stimulation with isoproterenol. These data suggest that mammalian Efr3s contribute to the control of the phosphorylation state and, hence, desensitization of AT1a receptors, and could affect responsiveness of G-protein-coupled receptors in higher eukaryotes.

Keywords: Angiotensin II; EFR3; GPCR; PI 4-kinase; Phosphoinositide; Receptor desensitization.


Figures

Fig. 1.
Fig. 1.
Relative expression of EFR3A and EFR3B mRNAs in various mouse tissues. Total RNA from various mouse tissues was isolated and cDNA synthesized as described in Materials and Methods. Real-time qPCR was performed using SYBR Green and primers specific for the respective mRNAs (see Materials and Methods). The signal was then normalized to that of 18S rRNA. Means+s.e.m. (n = 6) are shown from duplicate determinations of three independent mouse and tissue isolations. See the predominant expression of EFR3B in the brain and that of EFR3A in the testis.
Fig. 2.
Fig. 2.
Cellular localization and palmitoylation of the EFR3 proteins. (A) EFR3A and EFR3B proteins were tagged with GFP at their C-termini and expressed either in COS-7 cells or HEK293-AT1 cells. Cells were imaged live by confocal microscopy. Both proteins were found to primarily localize to the plasma membrane and this localization requires the N-terminus of the proteins to contain several cysteine residues. (B) Mutation of the four cysteine residues to serines eliminates localization of the full-length EFR3A (and EFR3B, not shown) proteins at the plasma membrane. The short N-terminal fragment of EFR3A, however, shows Golgi localization, suggesting that other determinants are also important for the plasma membrane localization of the protein. Without the cysteines, this short construct also loses its Golgi localization. (C) Palmitoylation of the EFR3 proteins: GFP-tagged EFR3A or EFR3B were expressed in COS-7 cells (PI4K2A-GFP was used in a separate dish as control) and cells were labeled with [3H]-palmitate for 4 hrs. Cells were lysed and the proteins immunoprecipitated using GFP-trap beads. Immunoprecipitated proteins were visualized using SDS-PAGE and the gel was incubated with EN3HANCE solution before drying and autoradiography (left). Parallel samples were run for western blotting using an anti-GFP antibody (right).
Fig. 3.
Fig. 3.
Depletion of EFR3s results in impaired cytoplasmic Ca2+ response without a notable depletion of PtdIns(4,5)P2. (A) The efficiency of an EFR3A knockdown was investigated by using two different siRNA duplexes; the levels of the endogenous EFR3A protein were measured. (B) EFR3B knockdown efficiency was tested using an expressed GFP-tagged protein because of the lack of suitable antibody to determine endogenous levels. (C) HEK293-AT1 cells cultured on 25 mm coverslips were treated with the indicated siRNAs for 3 days. Cells were loaded with Fura-2/AM and their Ca2+ responses to 100 nM (left) or 1 nM (right) AngII monitored in ratiometric imaging as described in Materials and Methods. The difference of the Ca2+ responses to 100 nM AngII was highly significant (for analyzing all time points >60 sec, P<0.0001); we either used unpaired t-test or the non-parametric Mann–Whitney test. (D,E) HEK293-AT1 cells treated with EFR3A and EFR3B siRNAs or with a control siRNA were labeled with [32P]phosphate for 3 h before stimulation with AngII (100 nM) for the indicated times. Reactions were terminated and lipids extracted and separated by TLC as detailed in Materials and Methods. Radioactivity was quantified by Phosphorimaging and expressed as the percentage of the pre-stimulatory value. Means±s.e.m. from three independent experiments are shown performed in duplicates.
Fig. 4.
Fig. 4.
Depletion of EFR3s failed to affect the cytoplasmic Ca2+ response of cells that express a C-terminally truncated AT1a receptor and augmented phosphorylation of the wild-type AT1a receptor. (A) HEK293 cells stably transfected with an AT1a receptor truncated at its C-terminus (to remove all phosphorylation sites) were treated with siRNAs targeting EFR3A and EFR3B or with a control siRNA. Measurements of cytoplasmic Ca2+ responses to AngII were as described in the legend to Fig. 3 (B) Phosphorylation of the wild-type AT1a receptor immunoprecipitated from HEK293-AT1 cells labeled with [32P]phosphate and stimulated with AngII for the indicated times. Note the already increased phosphorylation of the receptor before and the larger response after AngII stimulation. Representative phosphorimage of three similar observations. (C) Quantification and summary of three independent experiments. All radioactivity values in each experiment were expressed as the percentage of the value measured at the 5 minute time-point in EFR3AB-depleted cells. Means±s.e.m. (n = 3).
Fig. 5.
Fig. 5.
Internalization of the AT1a receptor is not inhibited by EFR3B depletion. (A) HEK293-AT1 cells treated with the indicated siRNAs were transfected with GFP-β-arrestin2 for 24 h and studied live under a confocal microscope at 30°C. Cells were treated with 100 nM AngII and images were acquired at the times indicated. (B) HEK293 cells stably expressing AT1aR-GFP were treated with the indicated siRNAs and studied live under a confocal microscope at 30°C. Cells were stimulated with 100 nM AngII and images were recorded at various time points. Note the higher fluorescence signal in the plasma membrane of control cells at 0 min compared with that of cells treated with EFR3B siRNA. These results were reproduced two times in multiple dishes (two or three) from independent knockdown experiments.
Fig. 6.
Fig. 6.
Effects of EFR3 depletion on AT1aR levels and AngII uptake. (A,B) HEK19 cells stably expressing HA-AT1aR-GFP were treated with control siRNA (control RNAi) or with EFR3A/B-targeting siRNA (EFR3 A/B RNAi). Cells were then fixed and immunostained against the HA epitope under non-permeabilizing conditions and analyzed using flow cytometry, recording the GFP signal of the total AT1aR population (left panel) and the cell-surface HA epitope signal (right panel). In B, control knockdown levels (control RNAi; black) were compared to those in EFR3 A/B knockdown cells (EFR3 A/B RNAi; gray) (n = 10,000 cells). Shown are grand averages ± range from two experiments. (C,D) HEK293-AT1 cells treated with control siRNA or siRNA directed against EFR3 A/B, were incubated with Alexa-Fluor-488-conjugated AngII for 5 min prior to acid wash and detection of internalized AngII by flow cytometry. EFR3 A/B depletion (right panel) did not alter the rate of AngII internalization when compared to the control knockdown (left panel) (n = 10,000 cells). Red, signals (C) and bars (D) indicate acid resistant fluorescent AngII uptake; black signals (C) and bars (D) indicate total cell-associated (surface + internalized) AngII fluorescence.. AU, arbitrary units.
Fig. 7.
Fig. 7.
Effect of EFR3B knockdown on Gq activation kinetics in HEK293 cells expressing wild-type or tail-deleted AT1a receptor. (A) Schematic of the principles of monitoring Gq activation using FRET. Upon excitation, the mTq fluorescent protein engineered into the Gq α-subunit will transfer its energy to the mutated YFP Venus, which is attached to the γ-subunit of the βγ complex in the tightly associated heterotrimer. After activation of the AT1a receptor, the dissociation of the heterotrimer will result in a decrease in direct energy transfer, which can be detected as an increased emission from mTq and a decreased emission from Venus (see (Goedhart et al., 2011) for details). (B) FRET measurements in HEK293-AT1 cells expressing the wild-type AT1a receptors were stimulated with increasing concentrations of AngII. (C) HEK293 cells expressing the wild-type AT1a receptors were treated for 3 days either with control siRNA (grey trace) or with EFR3B siRNA (red trace). Means±s.e.m. are shown for 250 and 216 cells in control and EFR3B-depleted cells, respectively, that were acquired in three independent knockdown experiments (note that the error bars are too small to be visible in the red trace). (D) FRET experiments as described in B, except that HEK293 cells expressing the truncated AT1a receptors were used. Means±s.e.m. are shown for 53 and 91 cells in control and EFR3B-depleted cells, respectively, that were acquired in two independent knockdown experiments. (E) cAMP changes in HEK293-AT1 cells that had been stimulated with isoproterenol. Cells were treated with siRNA against EFR3A/B or control siRNA and then transfected with a FRET-based cAMP sensor (Klarenbeek and Jalink, 2014) to monitor changes in cAMP levels. A decreased FRET means an increase in cAMP. Means±s.e.m. are shown of 50-52 cells for EFR3AB or control siRNA treated cells. These were obtained in two separate knockdown experiments and using six independent dishes for each group. The difference between the two curves at time points later than at 240 sec is statistically significant (P<0.0001; using either non-paired t-test or the non-parametric Mann–Whitney test).

Similar articles

Cited by

References

    1. Adjobo-Hermans M. J., Goedhart J., van Weeren L., Nijmeijer S., Manders E. M., Offermanns S., Gadella T. W., Jr (2011). Real-time visualization of heterotrimeric G protein Gq activation in living cells. BMC Biol. 9, 32 10.1186/1741-7007-9-32 - DOI - PMC - PubMed
    1. Audhya A., Emr S. D. (2002). Stt4 PI 4-kinase localizes to the plasma membrane and functions in the Pkc1-mediated MAP kinase cascade. Dev. Cell 2, 593–605 10.1016/S1534-5807(02)00168-5 - DOI - PubMed
    1. Baird D., Stefan C., Audhya A., Weys S., Emr S. D. (2008). Assembly of the PtdIns 4-kinase Stt4 complex at the plasma membrane requires Ypp1 and Efr3. J. Cell Biol. 183, 1061–1074 10.1083/jcb.200804003 - DOI - PMC - PubMed
    1. Balla A., Tuymetova G., Tsiomenko A., Várnai P., Balla T. (2005). A plasma membrane pool of phosphatidylinositol 4-phosphate is generated by phosphatidylinositol 4-kinase type-III alpha: studies with the PH domains of the oxysterol binding protein and FAPP1. Mol. Biol. Cell 16, 1282–1295 10.1091/mbc.E04-07-0578 - DOI - PMC - PubMed
    1. Balla A., Kim Y. J., Varnai P., Szentpetery Z., Knight Z., Shokat K. M., Balla T. (2008). Maintenance of hormone-sensitive phosphoinositide pools in the plasma membrane requires phosphatidylinositol 4-kinase IIIalpha. Mol. Biol. Cell 19, 711–721 10.1091/mbc.E07-07-0713 - DOI - PMC - PubMed

Publication types

MeSH terms