. 2014 Dec 12;289(50):34938-52.
doi: 10.1074/jbc.M114.600882. Epub 2014 Oct 28.

Investigation of interactions at the extracellular loops of the relaxin family peptide receptor 1 (RXFP1)

Affiliations

Investigation of interactions at the extracellular loops of the relaxin family peptide receptor 1 (RXFP1)

Natalie A Diepenhorst et al. J Biol Chem. .

Abstract

Relaxin, an emerging pharmaceutical treatment for acute heart failure, activates the relaxin family peptide receptor (RXFP1), which is a class A G-protein-coupled receptor. In addition to the classic transmembrane (TM) domain, RXFP1 possesses a large extracellular domain consisting of 10 leucine-rich repeats and an N-terminal low density lipoprotein class A (LDLa) module. Relaxin-mediated activation of RXFP1 requires multiple coordinated interactions between the ligand and various receptor domains including a high affinity interaction involving the leucine-rich repeats and a predicted lower affinity interaction involving the extracellular loops (ELs). The LDLa is essential for signal activation; therefore the ELs/TM may additionally present an interaction site to facilitate this LDLa-mediated signaling. To overcome the many challenges of investigating relaxin and the LDLa module interactions with the ELs, we engineered the EL1 and EL2 loops onto a soluble protein scaffold, mapping specific ligand and loop interactions using nuclear magnetic resonance spectroscopy. Key EL residues were subsequently mutated in RXFP1, and changes in function and relaxin binding were assessed alongside the RXFP1 agonist ML290 to monitor the functional integrity of the TM domain of these mutant receptors. The outcomes of this work make an important contribution to understanding the mechanism of RXFP1 activation and will aid future development of small molecule RXFP1 agonists/antagonists.

Keywords: G Protein-coupled Receptor (GPCR); Nuclear Magnetic Resonance (NMR); Peptide Hormone; Protein Engineering; RXFP1; Receptor Structure-Function; Relaxin; Serelaxin.


Figures

FIGURE 1.
FIGURE 1.
Schematic for the design of EL1/EL2-GB1. A, alignment of the sequence of tGB1 with the EL1/EL2-GB1 constructs showing the positions for the insertions of the EL1 and EL2 loops and the disulfide between EL1 and EL2. The loops are flanked by Gly-Gly sequences to enable flexibility. B, a schematic of model of the EL1/EL2-GB1 construct showing the putative positions of the disulfide, Trp37 in EL1, and Phe82 and Pro83 in EL2. Trp37, Phe82, and Pro83 are equivalent to Trp479, Phe564, and Pro565 in full-length receptor.
FIGURE 2.
FIGURE 2.
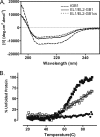
A, CD spectra of EL1/EL2-GB1 (solid line) and EL1/EL2-GB1cs (dotted line) exhibit less secondary structure compared with tGB1 (dashed line), which is consistent with the addition of unstructured loops. B, protein unfolding was measured by CD measurement at 222 nm at temperatures ranging from 20 to 90 °C. The control tGB1 (■) did not unfold over this temperature range; however, EL1/EL2-GB1 (●) and EL1/EL2-GB1cs (○) unfolded with Tm values of 65 °C and >70 °C, respectively.
FIGURE 3.
FIGURE 3.
Streptavidin pulldown assay to determine relaxin binding. A, the first panel shows that EL1/EL2-GB1 does not interact with streptavidin resin. In the second panel, EL1/EL2-GB1 is efficiently pulled down by biotinylated H2 relaxin. This interaction was disrupted with the addition of excess competitor of either unbiotinylated H2 relaxin (third panel) or the LDLa module (fourth panel). B and C, control proteins EL1/EL2-GB1cs (B) and GB1 (C) were unable to bind biotinylated H2 relaxin. U, unbound fraction; B, bound fraction to streptavidin beads. The data are from one representative experiment from three independent experiments.
FIGURE 4.
FIGURE 4.
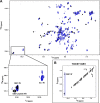
15N HSQC spectra of tGB1 (black) overlaid with EL1/EL2-GB1 (blue). A, the spectra show that the majority of dispersed peaks are most likely residues of the tGB1 scaffold with obvious glycine peptide and the tryptophan side chain resonances visibly unique to EL1/EL2-GB1. The inset highlights the tGB1 and EL1 tryptophan side chain resonances. B, TOCSY of tGB1 confirmed the identity of tGB1 tryptophan in the spectra. The additional resonance near 10.4 ppm (1H) and 131 ppm (15N) in the tGB1 spectra belongs to a peptide group. Experiments were conducted on protein at 150 μm in 50 mm phosphate buffer, pH 6.8, at 40 °C.
FIGURE 5.
FIGURE 5.
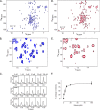
15N HSQC spectrum demonstrating H2 relaxin interacts with of EL1/EL2-GB1 and not EL1/EL2-GB1cs. The data were acquired in 50 mm NaH2PO4, pH 6.8, at 40 °C. A, overlay of the 15N HSQC spectra of EL1/EL2-GB1 with 0 (single black contour) and 10 μm H2 relaxin (blue contours) demonstrating resonances appearing and increasing in intensity upon the addition of H2 relaxin. B, expansion of a region of the overlay of EL1/EL2-GB1 at 0 and 10 μm H2 relaxin. C, resonances numbered in B are shown in cross-section at 0, 1, 5, 10, 50, and 100 μm H2 relaxin, demonstrating the dose dependence of the intensity changes. D, overlay of the 15N HSQC spectra of EL1/EL2-GB1cs with 0 (single black contour) and 10 μm H2 relaxin (red contours). E, expansion of a region of the overlay of EL1/EL2-GB1cs at 0 and 10 μm H2 relaxin showing no dose dependence changes to the spectra. F, the average change in intensity of 20 15N HSQC peaks for EL1/EL2-GB1 with the addition of H2 relaxin (Kd of 3.9 ± 0.9 μm). No peaks from EL1/EL2-GB1cs were able to exhibit the same response, indicating no interaction between EL1/EL2-GB1cs and H2 relaxin, confirming the results from the pulldown assay.
FIGURE 6.
FIGURE 6.
15N HSQC spectrum of EL1/EL2-GB1 demonstrating LDLa-dependent intensity increases and appearance of resonances indicative of an interaction. The data were acquired in 100 mm Tris, 10 mm CaCl2, pH 6.8, at 40 °C. A, overlay of the 15N HSQC spectra of EL1/EL2-GB1 with 0 (single black contour) and 100 μm LDLa module (blue contours) demonstrating resonances appearing and increasing in intensity upon the addition of the LDLa module. B, expansions of the 15N HSQC spectra in A demonstrating resonances appearing and increasing in intensity upon the addition of 100 μm LDLa. C, resonances numbered in B are shown in cross-section at 0, 5, 10, 100, and 200 μm LDLa, demonstrating the dose dependence of the intensity changes. D, the averaged peak intensity change for 20 resonances within the spectra that show intensity increases upon addition of LDLa with a Kd of 28.2 ± 3.2 μm.
FIGURE 7.
FIGURE 7.
A, chemical shift differences following a titration of 15N-labeled LDLa with 1:1 of EL1/EL2-GB1. Chemical shift differences were calculated by Δδ ppm = ((Δ1H)2 + (0.15Δ15N)2)1/2. The three lines are the mean chemical shift difference and the first and second standard deviations. B, residues whose 1H,15N resonances (assignments are from BioMagResbank Code 7321 (9)) show the most significant chemical shift changes are mapped onto a model of the LDLa module of RXFP1 (Protein Data Bank code 2jm4).
FIGURE 8.
FIGURE 8.
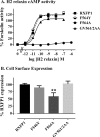
cAMP activity (A) and cell surface expression (B) of RXFP1 EL2 mutant receptors in transient transfection assays. Activity data are expressed as percentages of 5 μm forskolin response, and cell surface expression data are expressed as percentages of RXFP1 expression and are from at least three independent assays with triplicate determinations within each assay.
FIGURE 9.
FIGURE 9.
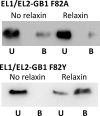
Streptavidin pulldown assay to determine relaxin binding to EL1/EL2-GB1 F82A and F82Y. In the first panels, both mutants did not interact with streptavidin resin alone. In the second panels, EL1/EL2-GB1 F82Y was able to be pulled down in the presence of biotinylated H2 relaxin similar to WT-EL1/EL2-GB1. EL1/EL2-F82A was unable to bind biotinylated H2 relaxin as seen with the EL1/EL2-GB1cs and tGB1 proteins. U, unbound fraction; B, bound fraction to streptavidin beads. The data are from one representative experiment of three independent experiments.
FIGURE 10.
FIGURE 10.
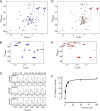
15N HSQC spectrum demonstrating H2 relaxin interacts with EL1/EL2-GB1 F82Y and not EL1/EL2-GB1F82A. The data were acquired in 50 mm NaH2PO4, pH 6.8, at 40 °C. A, overlay of the 15N HSQC spectra of EL1/EL2-GB1 F82Y with 0 (single black contour) and 10 μm H2 relaxin (blue contours) demonstrating resonances appearing and increasing in intensity upon the addition of H2 relaxin. B, expansion of a region of the overlay of EL1/EL2-GB1 F82Y at 0 and 10 μm H2 relaxin. C, resonances numbered in B are shown in cross-section in C at 0, 1, 5, 10, 50, and 100 μm H2 relaxin, demonstrating the dose dependence of the intensity changes. D, overlay of the 15N HSQC spectra of EL1/EL2-GB1 F82A with 0 (single black contour) and 10 μm H2 relaxin (red contours). E, expansion of a region of the overlay of EL1/EL2-GB1F82A at 0 and 10 μm H2 relaxin showing no dose dependence changes to the spectra. F, the average change in intensity of 14 15N HSQC peaks of EL1/EL2-GB1 F82Y with the addition of H2 relaxin (Kd of 2.5 ± 0.3 μm). No peaks from EL1/EL2-GB1 F82A were able to exhibit the same response, indicating no interaction between EL1/EL2-GB1F82A and H2 relaxin, confirming the results from the pulldown assay (Fig. 9).
FIGURE 11.
FIGURE 11.
cAMP activity assays demonstrating the response of Trp479 mutant receptor semistable cells W479A and W479L compared with wild-type RXFP1 stably expressing cells upon stimulation with H2 relaxin (A) or ML290 (B). The data are expressed as percentages of 5 μm forskolin response pooled from at least three independent assays (actual numbers in Table 2) with triplicate determinations within each assay.
FIGURE 12.
FIGURE 12.
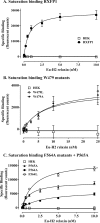
Comparison of H2 relaxin binding of mutant receptors compared with wild-type RXFP1 using Eu-H2 relaxin saturation binding assays. A, wild-type RXFP1 stably expressing cell line specific binding compared with parental HEK-293T cells. B, Trp479 mutant receptor semistable cells W479A and W479L. C, Phe564 mutant receptor semistable cells F564A and F564L compared with P565 mutant receptor semistable cells P565A. The data are pooled from at least three independent assays (actual numbers in Table 2) with triplicate determinations within each assay.
FIGURE 13.
FIGURE 13.
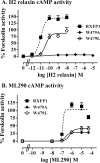
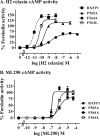
cAMP activity assays demonstrating the response of Phe564 mutant receptor semistable cells F564A, F564L, and P565A mutant receptor semistable cells compared with wild-type RXFP1 stably expressing cells upon stimulation with H2 relaxin (A) or ML290 (B). The data are expressed as percentages of 5 μm forskolin response pooled from at least three independent assays (actual numbers in Table 2) with triplicate determinations within each assay.

Similar articles

Cited by

References

    1. Bathgate R. A., Halls M. L., van der Westhuizen E. T., Callander G. E., Kocan M., Summers R. J. (2013) Relaxin family peptides and their receptors. Physiol. Rev. 93, 405–480 - PubMed
    1. Teerlink J. R., Cotter G., Davison B. A., Felker G. M., Filippatos G., Greenberg B. H., Ponikowski P., Unemori E., Voors A. A., Adams K. F., Jr., Dorobantu M. I., Grinfeld L. R., Jondeau G., Marmor A., Masip J., Pang P. S., Werdan K., Teichman S. L., Trapani A., Bush C. A., Saini R., Schumacher C., Severin T. M., Metra M. (2013) Serelaxin, recombinant human relaxin-2, for treatment of acute heart failure (RELAX-AHF): a randomised, placebo-controlled trial. Lancet 381, 29–39 - PubMed
    1. Glinka A., Dolde C., Kirsch N., Huang Y.-L., Kazanskaya O., Ingelfinger D., Boutros M., Cruciat C.-M., Niehrs C. (2011) LGR4 and LGR5 are R-spondin receptors mediating Wnt/[beta]-catenin and Wnt/PCP signalling. EMBO Rep. 12, 1055–1061 - PMC - PubMed
    1. Hsu S. Y., Kudo M., Chen T., Nakabayashi K., Bhalla A., van der Spek P. J., van Duin M., Hsueh A. J. (2000) The three subfamilies of leucine-rich repeat-containing G protein-coupled receptors (LGR): identification of LGR6 and LGR7 and the signaling mechanism for LGR7. Mol. Endocrinol. 14, 1257–1271 - PubMed
    1. Büllesbach E. E., Schwabe C. (2000) The relaxin receptor-binding site geometry suggests a novel gripping mode of interaction. J. Biol. Chem. 275, 35276–35280 - PubMed

Publication types

LinkOut - more resources