

miR-21 improves the neurological outcome after traumatic brain injury in rats
- PMID: 25342226
- PMCID: PMC4208064
- DOI: 10.1038/srep06718
miR-21 improves the neurological outcome after traumatic brain injury in rats
Abstract
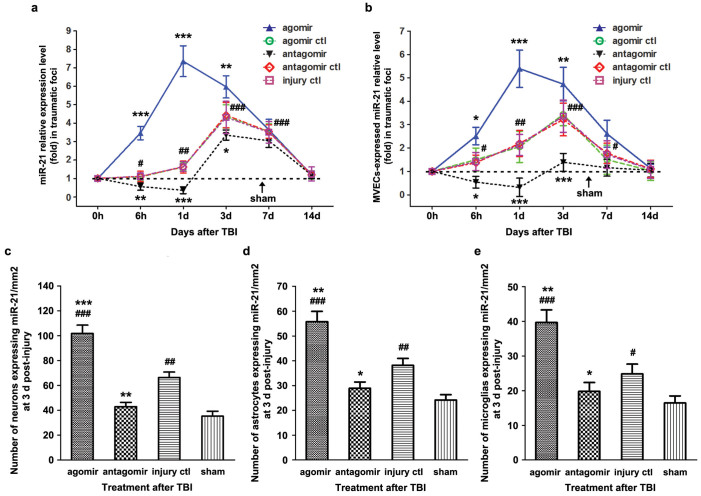
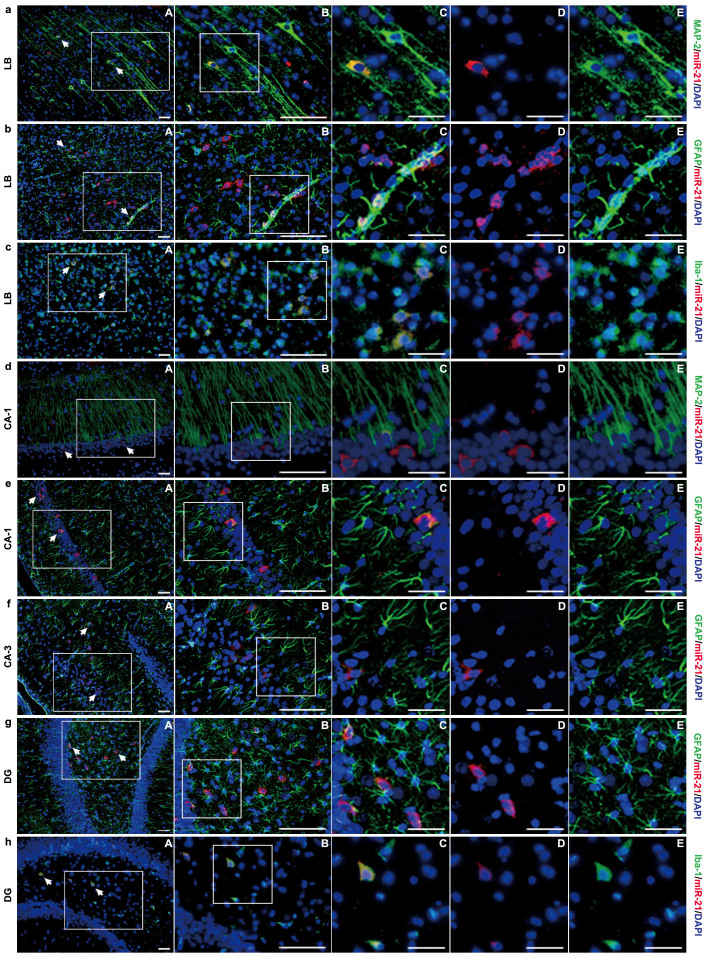
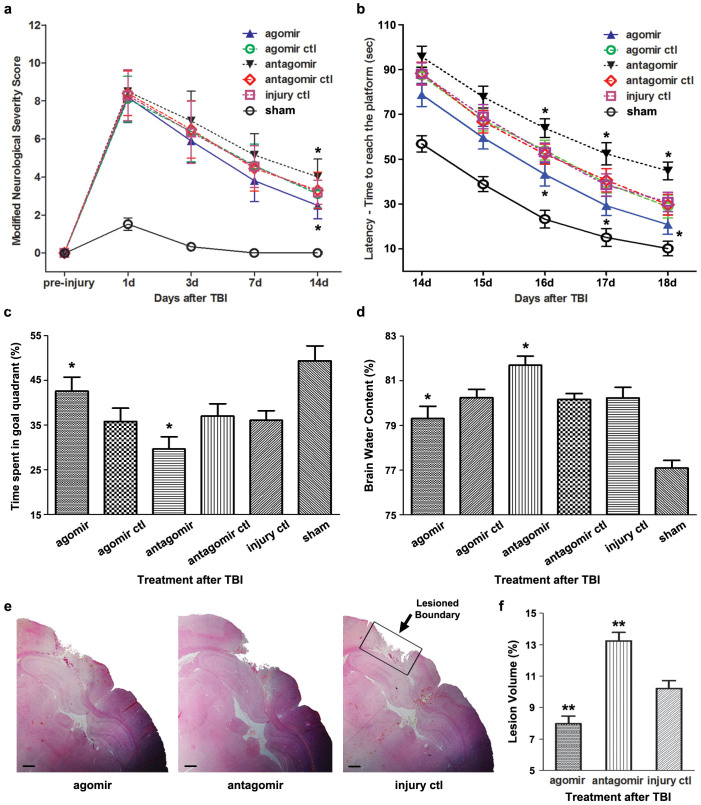
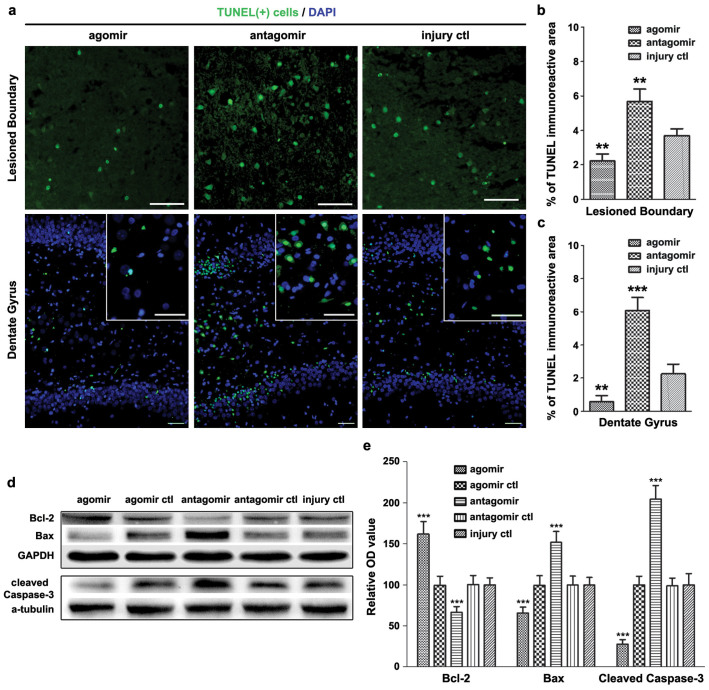
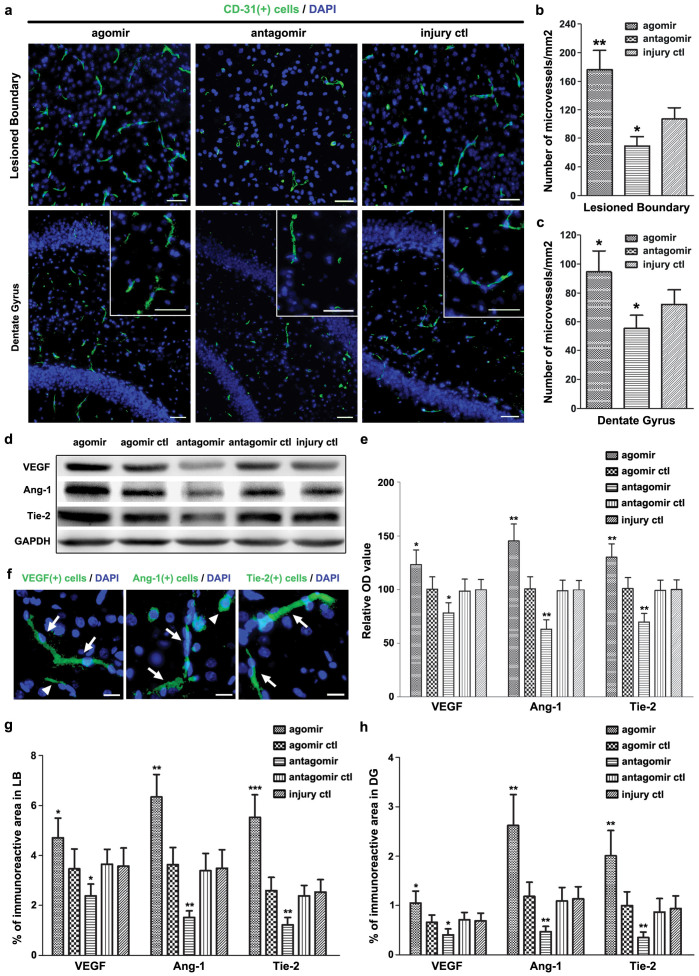
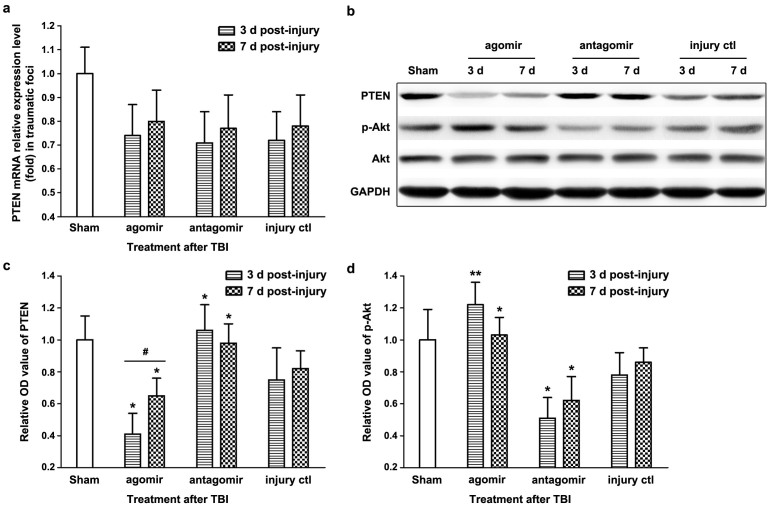
The expression levels of microRNAs (miRNAs) including miR-21, have been reported to change in response to traumatic brain injury (TBI), suggesting that they may influence the pathophysiological process in brain injury. To analyze the potential effect of miR-21 on neurological function after TBI, we employed the fluid percussion injury rat model and manipulated the expression level of miR-21 in brain using intracerebroventricular infusion of miR-21 agomir or antagomir. We found that upregulation of miR-21 level in brain conferred a better neurological outcome after TBI by improving long-term neurological function, alleviating brain edema and decreasing lesion volume. To further investigate the mechanism underlying this protective effect, we evaluated the impact of miR-21 on apoptosis and angiogenesis in brain after TBI. We found that miR-21 inhibited apoptosis and promoted angiogenesis through regulating the expression of apoptosis- and angiogenesis-related molecules. In addition, the expression of PTEN, a miR-21 target gene, was inhibited and Akt signaling was activated in the procedure. Taken together, these data indicate that miR-21 could be a potential therapeutic target for interventions after TBI.
Figures
Similar articles
-
miR-21 alleviated apoptosis of cortical neurons through promoting PTEN-Akt signaling pathway in vitro after experimental traumatic brain injury.Brain Res. 2014 Sep 25;1582:12-20. doi: 10.1016/j.brainres.2014.07.045. Epub 2014 Aug 6. Brain Res. 2014. PMID: 25108037
-
MicroRNA-23a-3p improves traumatic brain injury through modulating the neurological apoptosis and inflammation response in mice.Cell Cycle. 2020 Jan;19(1):24-38. doi: 10.1080/15384101.2019.1691763. Epub 2019 Dec 10. Cell Cycle. 2020. PMID: 31818176 Free PMC article.
-
MiR-21 alleviates secondary blood-brain barrier damage after traumatic brain injury in rats.Brain Res. 2015 Apr 7;1603:150-7. doi: 10.1016/j.brainres.2015.01.009. Epub 2015 Jan 15. Brain Res. 2015. PMID: 25598202
-
MicroRNA-126-3p attenuates blood-brain barrier disruption, cerebral edema and neuronal injury following intracerebral hemorrhage by regulating PIK3R2 and Akt.Biochem Biophys Res Commun. 2017 Dec 9;494(1-2):144-151. doi: 10.1016/j.bbrc.2017.10.064. Epub 2017 Oct 14. Biochem Biophys Res Commun. 2017. PMID: 29042193
-
Roles of microRNA-124 in traumatic brain injury: a comprehensive review.Front Cell Neurosci. 2023 Nov 28;17:1298508. doi: 10.3389/fncel.2023.1298508. eCollection 2023. Front Cell Neurosci. 2023. PMID: 38034588 Free PMC article. Review.
Cited by
-
Revisiting Traumatic Brain Injury: From Molecular Mechanisms to Therapeutic Interventions.Biomedicines. 2020 Sep 29;8(10):389. doi: 10.3390/biomedicines8100389. Biomedicines. 2020. PMID: 33003373 Free PMC article. Review.
-
Activation of the Hedgehog Pathway Promotes Recovery of Neurological Function After Traumatic Brain Injury by Protecting the Neurovascular Unit.Transl Stroke Res. 2020 Aug;11(4):720-733. doi: 10.1007/s12975-019-00771-2. Epub 2020 Jan 2. Transl Stroke Res. 2020. PMID: 31898187
-
Epigenetic mechanisms of neurodegenerative diseases and acute brain injury.Neurochem Int. 2020 Feb;133:104642. doi: 10.1016/j.neuint.2019.104642. Epub 2019 Dec 12. Neurochem Int. 2020. PMID: 31838024 Free PMC article. Review.
-
Non-coding RNAs and neuroprotection after acute CNS injuries.Neurochem Int. 2017 Dec;111:12-22. doi: 10.1016/j.neuint.2017.01.015. Epub 2017 Jan 26. Neurochem Int. 2017. PMID: 28131900 Free PMC article. Review.
-
Administration of Tauroursodeoxycholic Acid Attenuates Early Brain Injury via Akt Pathway Activation.Front Cell Neurosci. 2017 Jul 6;11:193. doi: 10.3389/fncel.2017.00193. eCollection 2017. Front Cell Neurosci. 2017. PMID: 28729823 Free PMC article.
References
-
- Feigin V. L. et al. Incidence of traumatic brain injury in New Zealand: a population-based study. Lancet Neurol 12, 53–64 (2013). - PubMed
-
- Li S. et al. SDF-1alpha induces angiogenesis after traumatic brain injury. Brain Res 1444, 76–86 (2012). - PubMed
-
- Zweckberger K. et al. Effect of early and delayed decompressive craniectomy on secondary brain damage after controlled cortical impact in mice. J Neurotrauma 23, 1083–1093 (2006). - PubMed
-
- Esteller M. Non-coding RNAs in human disease. Nat Rev Genet 12, 861–874 (2011). - PubMed
Publication types
MeSH terms
Substances
LinkOut - more resources
Full Text Sources
Other Literature Sources
Research Materials
