. 2014 Nov;124(11):4781-94.
doi: 10.1172/JCI74337. Epub 2014 Oct 20.

Cytokine therapy reverses NK cell anergy in MHC-deficient tumors

Cytokine therapy reverses NK cell anergy in MHC-deficient tumors

Michele Ardolino et al. J Clin Invest. 2014 Nov.

Abstract

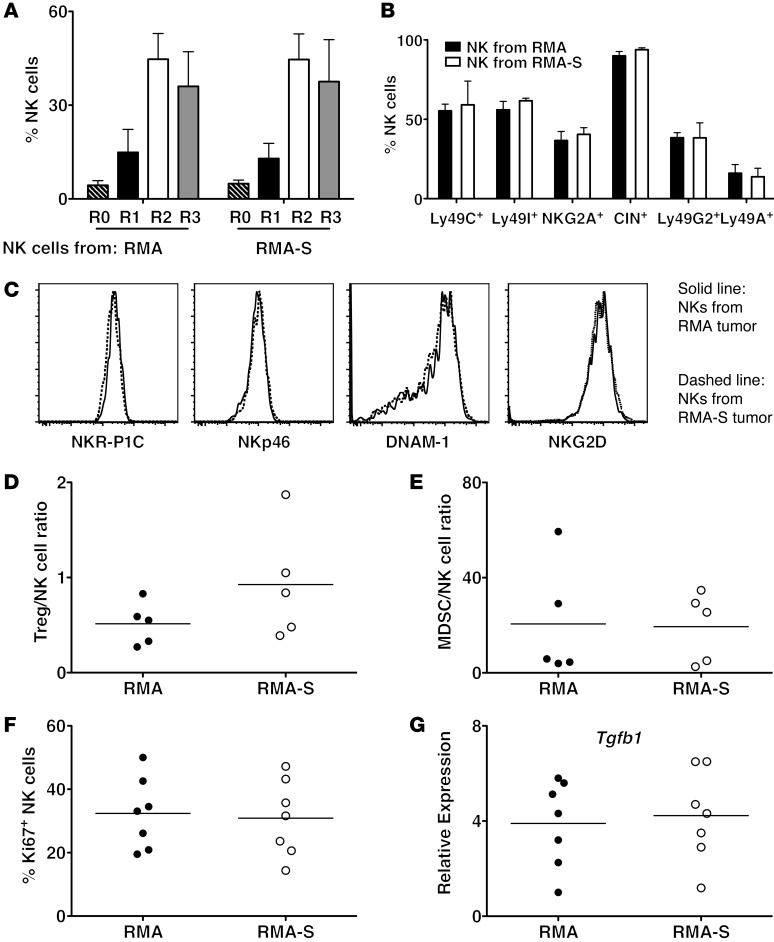
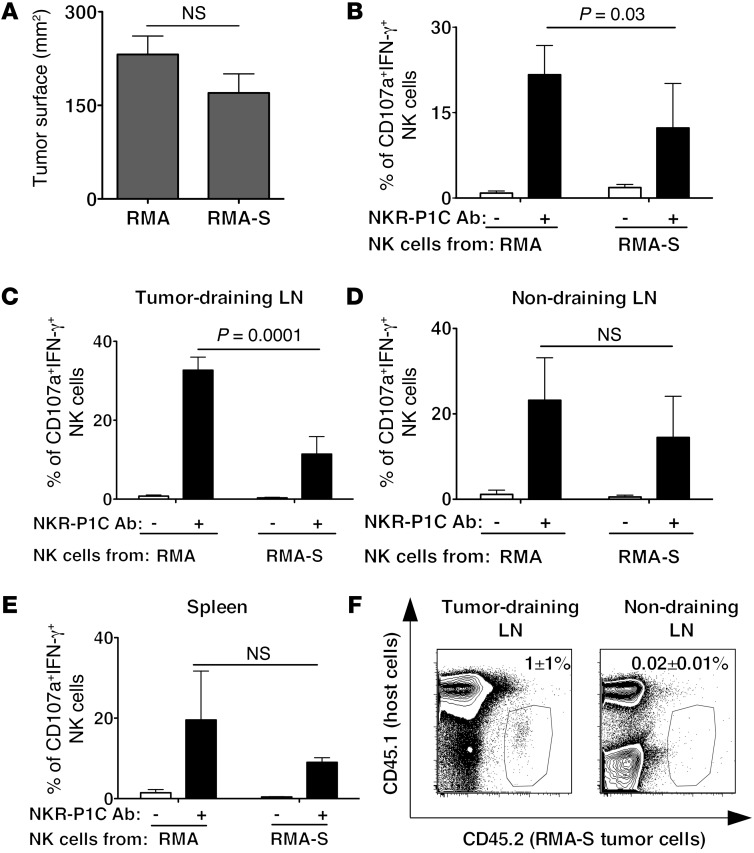
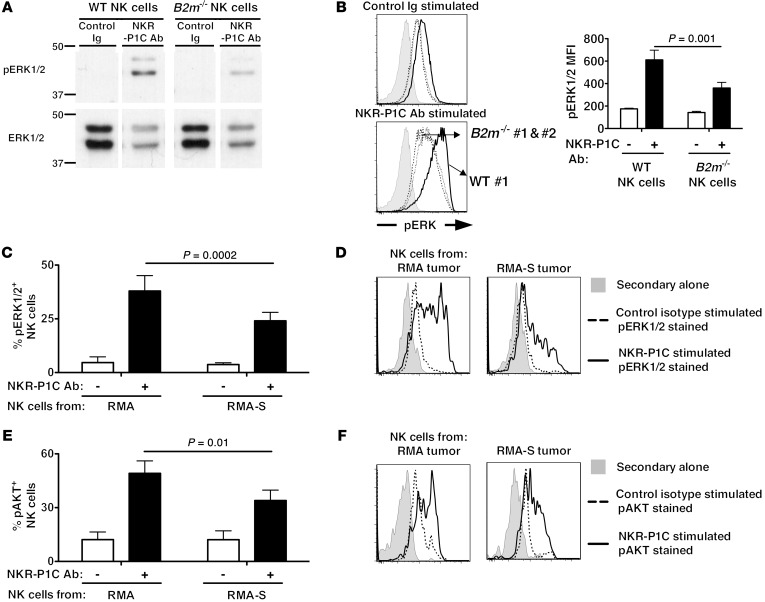
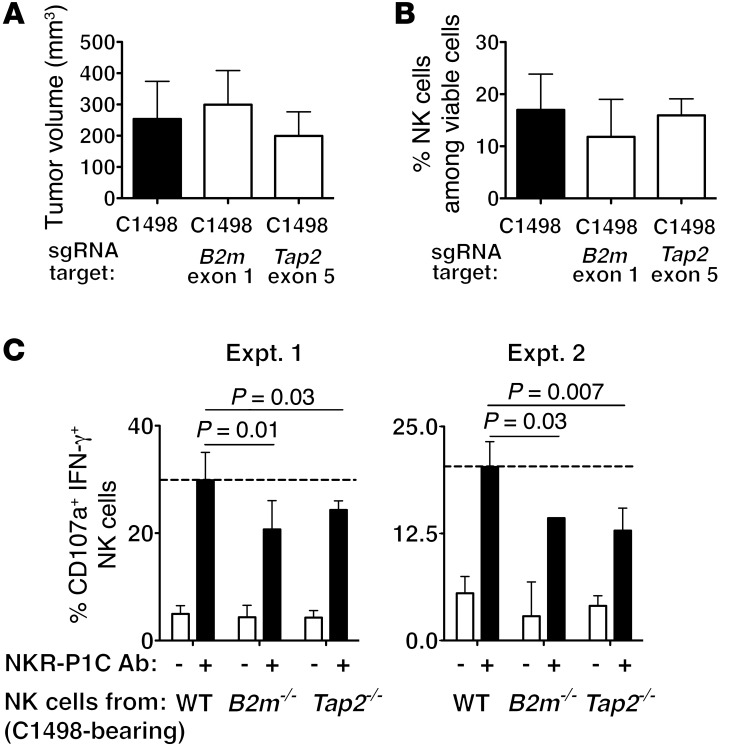
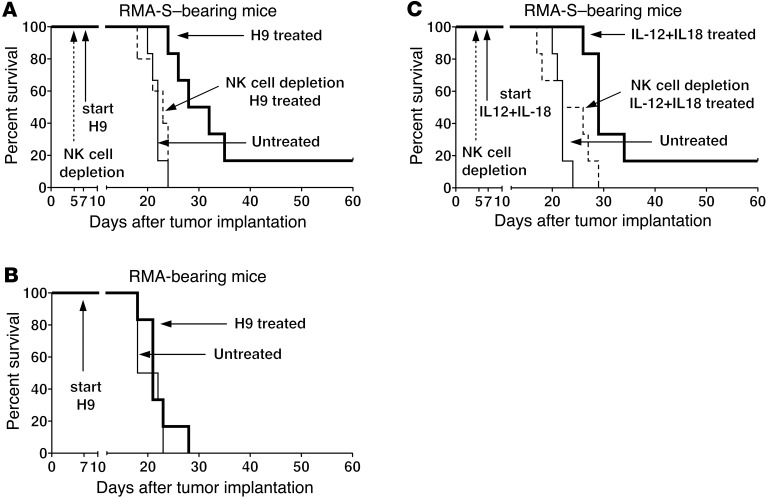
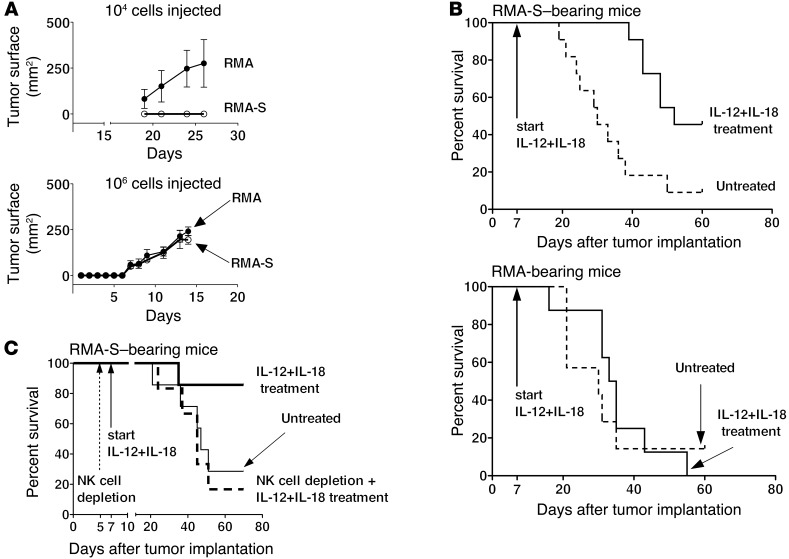
Various cytokines have been evaluated as potential anticancer drugs; however, most cytokine trials have shown relatively low efficacy. Here, we found that treatments with IL-12 and IL-18 or with a mutant form of IL-2 (the "superkine" called H9) provided substantial therapeutic benefit for mice specifically bearing MHC class I-deficient tumors, but these treatments were ineffective for mice with matched MHC class I+ tumors. Cytokine efficacy was linked to the reversal of the anergic state of NK cells that specifically occurred in MHC class I-deficient tumors, but not MHC class I+ tumors. NK cell anergy was accompanied by impaired early signal transduction and was locally imparted by the presence of MHC class I-deficient tumor cells, even when such cells were a minor population in a tumor mixture. These results demonstrate that MHC class I-deficient tumor cells can escape from the immune response by functionally inactivating NK cells, and suggest cytokine-based immunotherapy as a potential strategy for MHC class I-deficient tumors. These results suggest that such cytokine therapies would be optimized by stratification of patients. Moreover, our results suggest that such treatments may be highly beneficial in the context of therapies to enhance NK cell functions in cancer patients.


Figures

Figure 9
Figure 9. IL-12 and IL-18 treatment restores responsiveness in anergic NK cells.
(A) Cells obtained from RMA or RMA-S tumors were restimulated in vitro with 2 doses of IL-18 and IL-12 for 5 hours before accumulation of IFN-γ on NK cells was assessed by flow cytometry. (B) Splenic cells from WT or B2m–/–Ncr1+/gfp mice were stimulated for 30 minutes with no cytokines or with 50 ng/ml of IL-18 plus 10 ng/ml of IL-12 before ERK1/2 phosphorylation was assessed by flow cytometry. (C) Cells obtained from RMA or RMA-S tumors implanted in Ncr1+/gfp mice were stimulated for 30 minutes with the indicated doses of IL-18+IL-12, and pERK1/2 was analyzed by flow cytometry. (D) Splenic cells from WT or B2m–/–Ncr1+/gfp mice were stimulated for 30 minutes with the indicated doses of IL-2 or H9, and pERK1/2 was analyzed by flow cytometry. (E and F) Thirteen days after injection of RMA-S cells, mice were treated or not with 100 ng each of IL-12 and IL-18, and the responsiveness of tumor-infiltrating NK cells (E) was assessed as described in the legend to Figure 3. Expression of CD25 (F) was determined by flow cytometry. In A, E, and F, NK cells were gated as indicated in the legend to Figure 3, whereas in BD, NK cells were GFP+. Bars represent means ± SD. The experiments included at least 4 mice per group and were performed 3 times with similar results. Statistical analyses were performed with the unpaired Student’s t test.
Figure 8
Figure 8. A minor fraction of MHC class I–deficient tumor cells dominantly induces NK cell anergy.
Mice were injected with RMA, RMA-S, or mixtures of the 2 cell lines at the ratios shown. After 14 days, tumor sizes (A) were evaluated by caliper measurements. The ratios between RMA and RMA-S in the tumors (B) were determined by analysis of MHC class I expression on tumor cells. NK cell responsiveness (C) was determined as described in the legend to Figure 3. The experiments included at least 4 mice per group and were performed 2 times with similar results. Bars represent means ± SD. Statistical analyses were performed with the 2-tailed unpaired Student’s t test. *P < 0.05 with respect to RMA group.
Figure 7
Figure 7. NK cell anergy in MHC class I–deficient tumor-bearing mice is not associated with alterations in NK cell subpopulations, increased recruitment of immune-infiltrating cells, increased proliferation, or differences in the inflammatory environment.
(A and B) NK cells from RMA or RMA-S tumors were stained with antibodies for CD27 and CD11b to identify the R0–R3 stages (R0 = CD27CD11b; R1 = CD27+CD11b; R2 = CD27+CD11b+; R3 = CD27CD11b+) or for the inhibitory receptors Ly49C, Ly49I, NKG2A, Ly49G, and Ly49A. “CIN+” in the graph indicates NK cells expressing at least 1 of the 3 receptors Ly49C, Ly49I, and NKG2A. Bars represent means ± SD. (C) NK cells from RMA or RMA-S tumors were stained for NKp46, NKR-P1C, DNAM-1, and NKG2D. Representative histograms are shown. (D and E) Ratios of Tregs or MDSCs to NK cells were calculated in RMA- or RMA-S–derived tumors. NK cells were gated as viable-CD3CD19Ter119NKp46+ cells. Tregs were gated as viable-CD19Ter119NKp46CD3+CD4+Foxp3+ cells, and MDSCs were gated as viable-CD3CD19Ter119NKp46CD11b+ cells. (F) Proliferation status of NK cells infiltrating RMA or RMA-S tumors was assessed by Ki67 staining. (G) Relative expression of Tgfb1 mRNA was determined by quantitative PCR in RNA prepared from whole tumor lysates. The experiments included at least 4 mice per group and were performed 3 (A, B, and DG) or 2 (C) times with similar results. Statistical analyses were performed with the 2-tailed unpaired Student’s t test.
Figure 6
Figure 6. NK cell anergy is locally induced and requires close proximity with MHC class I–deficient tumor cells.
(A and B) RMA or RMA-S cells were injected in 2 different flanks of the same mice, and tumor size (A) and NK cell responsiveness (B) were evaluated at day 14. (CE) Responsiveness of NK cells from tumor-draining or nondraining lymph nodes or the spleen was determined as described in the legend to Figure 3. Bars represent means ± SD. (F) RMA-S tumor cells (CD45.2+) were injected in B6-CD45.1+ mice, and after 14 days the content of tumor cells in the tumor-draining or nondraining lymph nodes was determined. Two representative plots are depicted, while the percentages in the plots represent means ± SD of 3 independent experiments with n = 9 total. NK cells were gated as described above. The experiments included at least 4 mice per group and were performed 2 (A and B) or 3 (CF) times with similar results. Statistical analyses were performed with the 2-tailed unpaired Student’s t test, except for B, where a 2-tailed paired Student’s t test was used.
Figure 5
Figure 5. NK cells infiltrating MHC class I–deficient tumors exhibit impaired signaling downstream of activating receptors.
(A) Splenic NK cells were sorted from WT or B2m–/–Ncr1+/GFP mice and stimulated with NKR-P1C mAb or control IgG for 30 minutes. Western blot analysis was performed on cell lysates using a pERK1/2 mAb. Total ERK1/2 was used as a control. The samples were run on the same gel. The apparent difference in total ERK1/2 amounts between unstimulated and stimulated samples was due to unequal loading of the samples (data not shown). (B) Splenic cells from WT or B2m–/–Ncr1+/gfp mice were stimulated with NKR-P1C mAb or control IgG for 3 minutes, and pERK1/2 levels on NK cells were analyzed by intracellular staining. (CF) Ncr1+/gfp mice were injected with RMA or RMA-S cells, and after 14 days, tumor-infiltrating leukocytes were stimulated with NKR-P1C mAb or control IgG as in B. Cells were then fixed and stained for pERK1/2 (C and D) or pAKT (E and F). The pERK and pAKT profiles of tumor-derived NK samples were somewhat erratic because of the analysis of relatively few NK cells (~1,000) per sample, but comparing numerous animals, the differences were highly significant. (BF) NK cells were identified by GFP expression. Bars represent means ± SD. The experiments included at least 4 mice per group and were performed 2 (A), 3 (B), or 4 (CF) times with similar results. Statistical analyses were performed with the unpaired Student’s t test.
Figure 4
Figure 4. Anergy of NK cells infiltrating MHC class I–deficient mutants of the C1498 cell line.
C1498, C1498-B2m, and C1498-Tap2 cells were implanted s.c. into B6 mice. After 14 days, tumor volume was measured (A), and NK cell infiltration (B) and responsiveness (C) were assessed as described in the legend to Figure 3. In C, 2 independent experiments are shown. Bars represent means ± SD. NK cells were gated as in Figure 3. The experiments included at least 5 mice per group. Statistical analyses were performed with the 2-tailed unpaired Student’s t test.
Figure 3
Figure 3. NK cells infiltrating MHC class I–deficient tumors have impaired functional responsiveness.
(AC) Fourteen days after implantation, the percentages of NK cells among the viable cells in the tumors (A) and their responsiveness (B and C) were assessed by flow cytometry. Infiltrating leukocytes were restimulated in vitro with NKR-P1C antibody or control IgG (indicated as “+” and “–” in the legends), and IFN-γ accumulation and/or CD107a expression were determined. (D) Functional responsiveness of NK cells infiltrating tumors derived from RMA, RMA-S, or RMA-S/Tap2 cells was assayed as described in A. (E) RMA or RMA-S cells were injected in a Matrigel solution 7, 10, or 14 days before the functional assays were performed. (F) Tumor-infiltrating leukocytes were restimulated in vitro with NKp46 antibody or control IgG, and IFN-γ accumulation and CD107a expression were evaluated. (G) RMA or RMA-S cells were implanted in Ubi-GFP/BL6 hosts, and after 14 days tumor-infiltrating leukocytes were sorted and cocultured for 5 hours with YAC-1 cells at an effector/target ratio of 10:1. NK cell degranulation was determined by assaying of CD107a expression at the cell surface. (H) Leukocytes from RMA or RMA-S tumors were stimulated with PMA and ionomycin before IFN-γ accumulation on NK cells was measured by flow cytometry. In all graphs, bars represent means ± SD. In all panels NK cells were gated as viable-CD3CD19Ter119NKp46+ cells. The experiments included at least 4 mice per group and were performed 10 (B), 3 (D and F), or 2 (E, G, and H) times with similar results. Statistical analyses were performed with the 2-tailed unpaired Student’s t test.
Figure 2
Figure 2. Treatment with IL-2 mutant H9 superkine increases survival of RMA-S–bearing mice in an NK-dependent fashion.
106 RMA-S or RMA cells were injected s.c. in B6 mice. In A and C, a group of mice were depleted of NK cells by a weekly i.p. injection of 200 μg of PK136 antibody, starting 5 days after implantation of tumor cells. In A and B, mice were treated with 20 μg of H9 every other day starting 7 days after tumor implantation, whereas in C, mice were treated with 100 ng each of IL-12+IL-18 every other day starting 7 days after tumor implantation. The “Untreated” group is shared by A and C. The log-rank (Mantel-Cox) test was used to compare: in A, Untreated versus H9-treated mice (P = 0.002); in B, Untreated versus H9-treated mice (NS); and in C, Untreated versus IL-12+IL-18–treated mice (P = 0.001). The experiments included at least 5 mice per group and were performed 4 times with similar results.
Figure 1
Figure 1. IL-12+IL-18 treatment increases survival of mice bearing MHC class I–deficient tumors.
(A) 104 or 106 RMA or RMA-S cells were injected s.c. in B6 mice. Tumor growth was assessed by caliper measurement. (B and C) Kaplan-Meier analyses of RMA-S– or RMA-bearing mice treated or not with 100 ng each of IL-12+IL-18 every other day starting 7 days after implanting 106 tumor cells. In C, 1 group of mice was depleted of NK cells by a weekly i.p. injection of 200 μg of PK136 antibody, starting 5 days after implantation of tumor cells. NK depletion of the cytokine-treated group resulted in significantly reduced survival (P = 0.02) according to the log-rank (Mantel-Cox) test. The experiments included at least 4 mice per group and were performed at least 2 times with similar results.

Comment in

Similar articles

Cited by

References

    1. Margolin K. Cytokine therapy in cancer. Expert Opin Biol Ther. 2008;8(10):1495–1505. doi: 10.1517/14712598.8.10.1495. - DOI - PubMed
    1. Atkins MB, Regan M, McDermott D. Update on the role of interleukin 2 and other cytokines in the treatment of patients with stage IV renal carcinoma. Clin Cancer Res. 2004;10(18 pt 2):6342S–6346S. - PubMed
    1. Coughlin CM, et al. Interleukin-12 and interleukin-18 synergistically induce murine tumor regression which involves inhibition of angiogenesis. J Clin Invest. 1998;101(6):1441–1452. doi: 10.1172/JCI1555. - DOI - PMC - PubMed
    1. Yoshimoto T, Nagai N, Ohkusu K, Ueda H, Okamura H, Nakanishi K. LPS-stimulated SJL macrophages produce IL-12 and IL-18 that inhibit IgE production in vitro by induction of IFN-γ production from CD3intIL-2R β+ T cells. J Immunol. 1998;161(3):1483–1492. - PubMed
    1. Yoshimoto T, et al. IL-12 up-regulates IL-18 receptor expression on T cells, Th1 cells, and B cells: synergism with IL-18 for IFN-γ production. J Immunol. 1998;161(7):3400–3407. - PubMed

Publication types

MeSH terms