

In situ drug-receptor binding kinetics in single cells: a quantitative label-free study of anti-tumor drug resistance
- PMID: 25312029
- PMCID: PMC4196117
- DOI: 10.1038/srep06609
In situ drug-receptor binding kinetics in single cells: a quantitative label-free study of anti-tumor drug resistance
Abstract
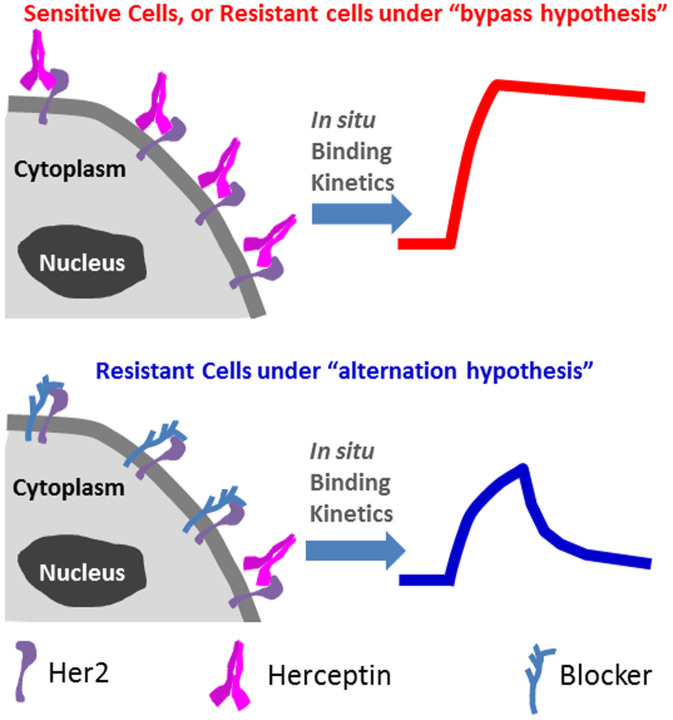
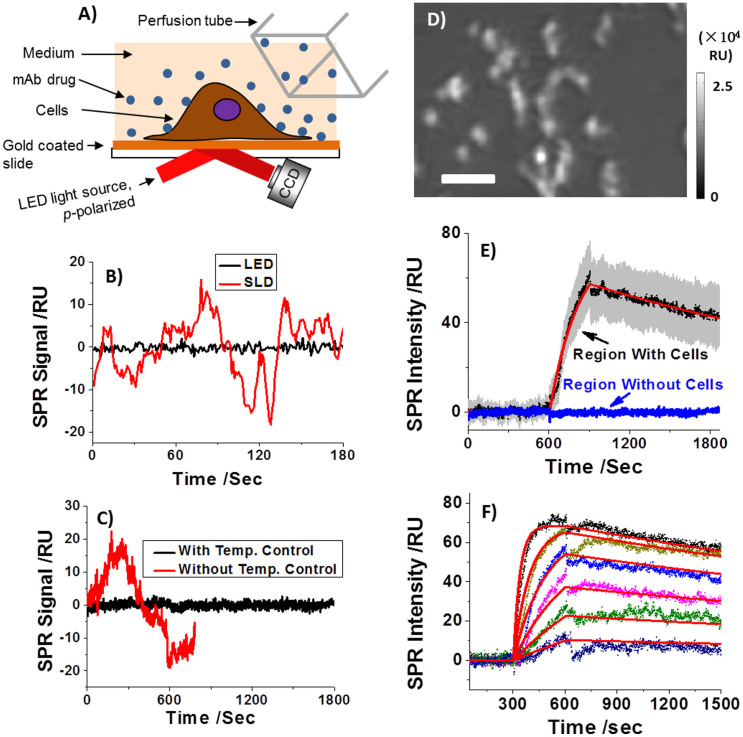
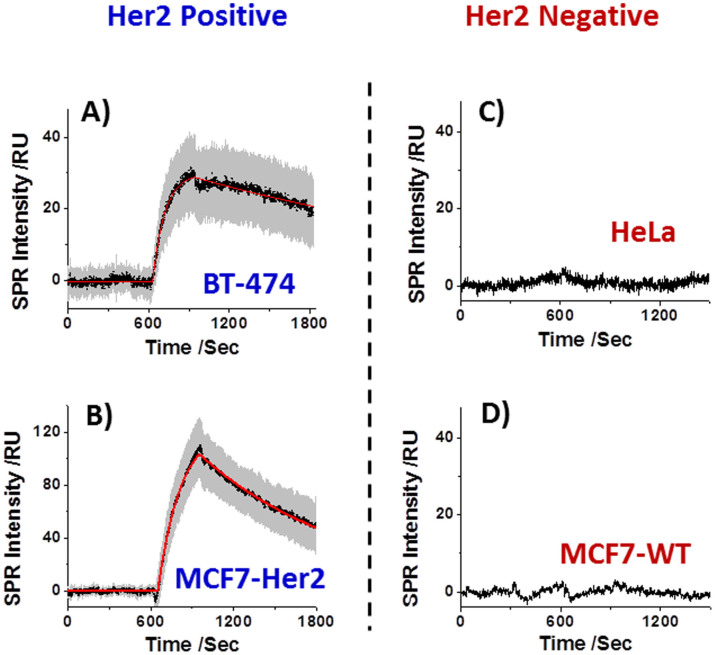
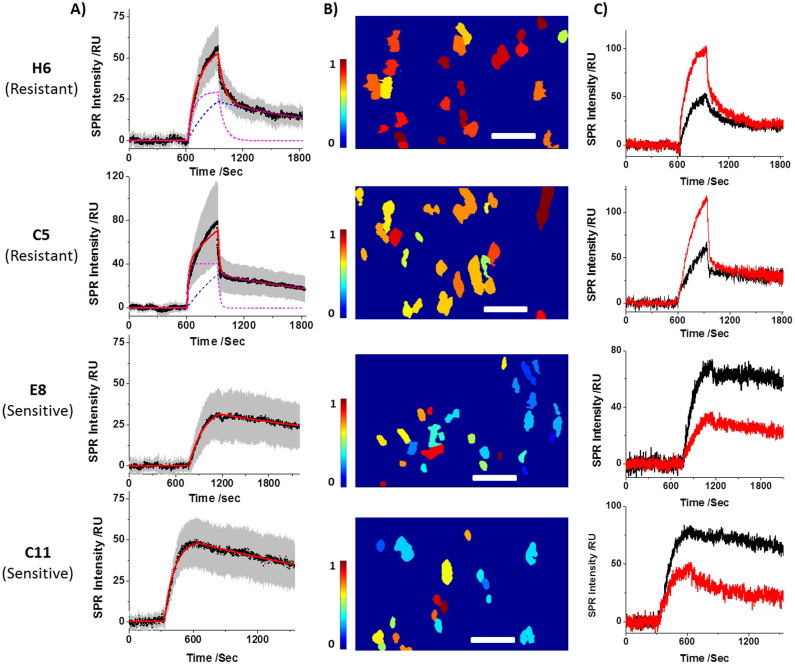
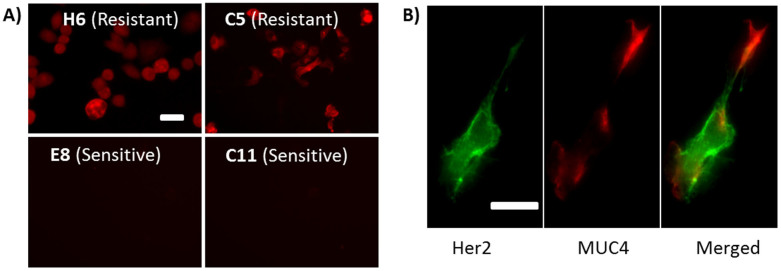
Many drugs are effective in the early stage of treatment, but patients develop drug resistance after a certain period of treatment, causing failure of the therapy. An important example is Herceptin, a popular monoclonal antibody drug for breast cancer by specifically targeting human epidermal growth factor receptor 2 (Her2). Here we demonstrate a quantitative binding kinetics analysis of drug-target interactions to investigate the molecular scale origin of drug resistance. Using a surface plasmon resonance imaging, we measured the in situ Herceptin-Her2 binding kinetics in single intact cancer cells for the first time, and observed significantly weakened Herceptin-Her2 interactions in Herceptin-resistant cells, compared to those in Herceptin-sensitive cells. We further showed that the steric hindrance of Mucin-4, a membrane protein, was responsible for the altered drug-receptor binding. This effect of a third molecule on drug-receptor interactions cannot be studied using traditional purified protein methods, demonstrating the importance of the present intact cell-based binding kinetics analysis.
Figures
Similar articles
-
Defining the optimum strategy for identifying adults and children with coeliac disease: systematic review and economic modelling.Health Technol Assess. 2022 Oct;26(44):1-310. doi: 10.3310/ZUCE8371. Health Technol Assess. 2022. PMID: 36321689 Free PMC article.
-
Depressing time: Waiting, melancholia, and the psychoanalytic practice of care.In: Kirtsoglou E, Simpson B, editors. The Time of Anthropology: Studies of Contemporary Chronopolitics. Abingdon: Routledge; 2020. Chapter 5. In: Kirtsoglou E, Simpson B, editors. The Time of Anthropology: Studies of Contemporary Chronopolitics. Abingdon: Routledge; 2020. Chapter 5. PMID: 36137063 Free Books & Documents. Review.
-
Impact of residual disease as a prognostic factor for survival in women with advanced epithelial ovarian cancer after primary surgery.Cochrane Database Syst Rev. 2022 Sep 26;9(9):CD015048. doi: 10.1002/14651858.CD015048.pub2. Cochrane Database Syst Rev. 2022. PMID: 36161421 Free PMC article. Review.
-
Identification of a novel toxicophore in anti-cancer chemotherapeutics that targets mitochondrial respiratory complex I.Elife. 2020 May 20;9:e55845. doi: 10.7554/eLife.55845. Elife. 2020. PMID: 32432547 Free PMC article.
-
Enabling Systemic Identification and Functionality Profiling for Cdc42 Homeostatic Modulators.bioRxiv [Preprint]. 2024 Jan 8:2024.01.05.574351. doi: 10.1101/2024.01.05.574351. bioRxiv. 2024. Update in: Commun Chem. 2024 Nov 19;7(1):271. doi: 10.1038/s42004-024-01352-7 PMID: 38260445 Free PMC article. Updated. Preprint.
Cited by
-
Label-Free Optical Imaging of Nanoscale Single Entities.ACS Sens. 2024 Feb 23;9(2):543-554. doi: 10.1021/acssensors.3c02526. Epub 2024 Feb 12. ACS Sens. 2024. PMID: 38346398 Review.
-
Activating HER2 mutations as emerging targets in multiple solid cancers.ESMO Open. 2017 Nov 24;2(5):e000279. doi: 10.1136/esmoopen-2017-000279. eCollection 2017. ESMO Open. 2017. PMID: 29209536 Free PMC article. Review.
-
Cellular glycosylation affects Herceptin binding and sensitivity of breast cancer cells to doxorubicin and growth factors.Sci Rep. 2017 Feb 22;7:43006. doi: 10.1038/srep43006. Sci Rep. 2017. PMID: 28223691 Free PMC article.
-
Studies with neutralizing antibodies suggest CXCL8-mediated neutrophil activation is independent of C-C motif chemokine receptor-like 2 (CCRL2) ligand binding function.PLoS One. 2023 Jan 20;18(1):e0280590. doi: 10.1371/journal.pone.0280590. eCollection 2023. PLoS One. 2023. PMID: 36662882 Free PMC article.
-
In-Depth Comparison of Lysine-Based Antibody-Drug Conjugates Prepared on Solid Support Versus in Solution.Antibodies (Basel). 2018 Jan 7;7(1):6. doi: 10.3390/antib7010006. Antibodies (Basel). 2018. PMID: 31544859 Free PMC article.
References
-
- Ehrlich P. Address in pathology on chemotherapeutics: Scientific principles, methods, and results. Lancet 2, 445–451 (1913).
-
- Adams G. P. & Weiner L. M. Monoclonal antibody therapy of cancer. Nature Biotechnol. 23, 1147–1157 (2005). - PubMed
-
- Copeland R. A., Pompliano D. L. & Meek T. D. Opinion - Drug-target residence time and its implications for lead optimization. Nature Rev. Drug Disc. 5, 730–739 (2006). - PubMed
-
- Swinney D. C. The role of binding kinetics in therapeutically useful drug action. Curr. Opin. Drug Disc. Develop. 12, 31–39 (2009). - PubMed
-
- Nahta R., Yu D. H., Hung M. C., Hortobagyi G. N. & Esteva F. J. Mechanisms of disease: understanding resistance to HER2-targeted therapy in human breast cancer. Nature Clin. Pract. Oncol. 3, 269–280 (2006). - PubMed
Publication types
MeSH terms
Substances
Grants and funding
LinkOut - more resources
Full Text Sources
Other Literature Sources
Medical
Research Materials
Miscellaneous
