. 2014 Dec;5(12):912-27.
doi: 10.1007/s13238-014-0104-6. Epub 2014 Oct 15.

Coronavirus membrane-associated papain-like proteases induce autophagy through interacting with Beclin1 to negatively regulate antiviral innate immunity

Affiliations

Coronavirus membrane-associated papain-like proteases induce autophagy through interacting with Beclin1 to negatively regulate antiviral innate immunity

Xiaojuan Chen et al. Protein Cell. 2014 Dec.

Abstract

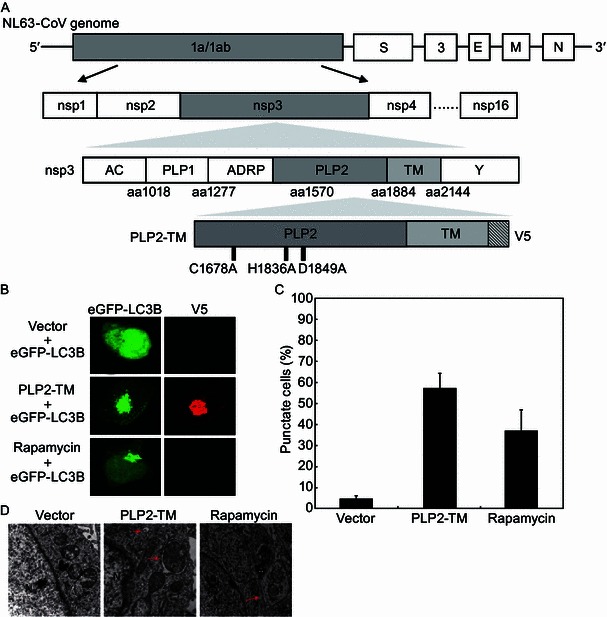
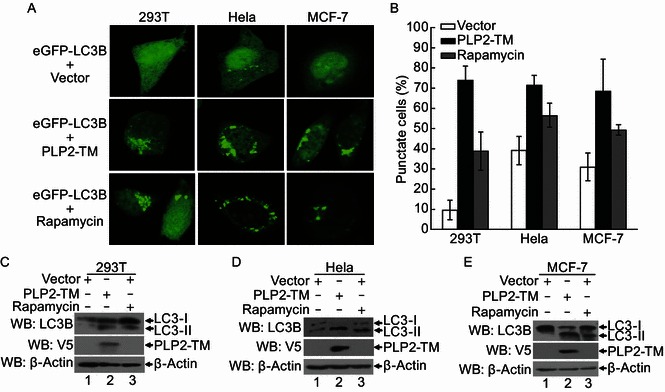
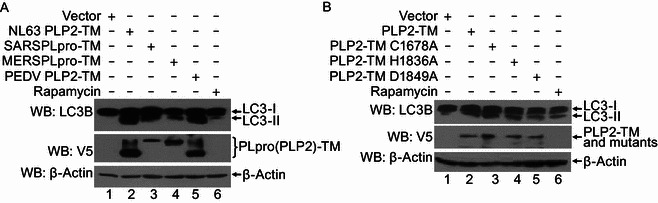
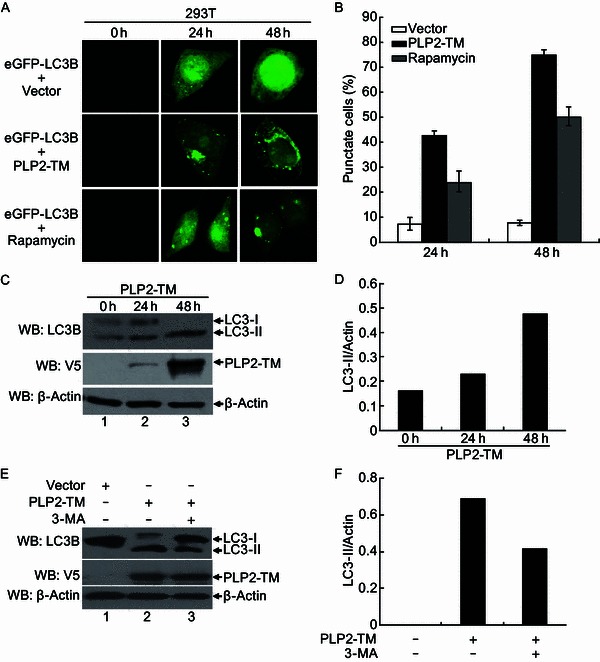
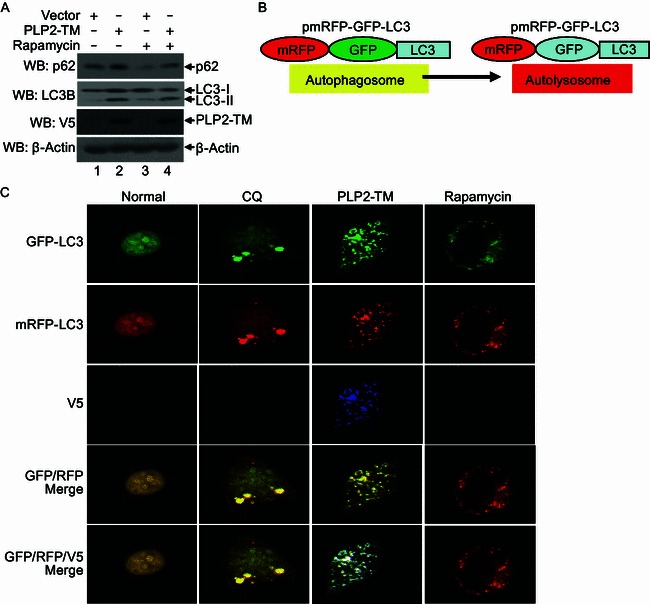
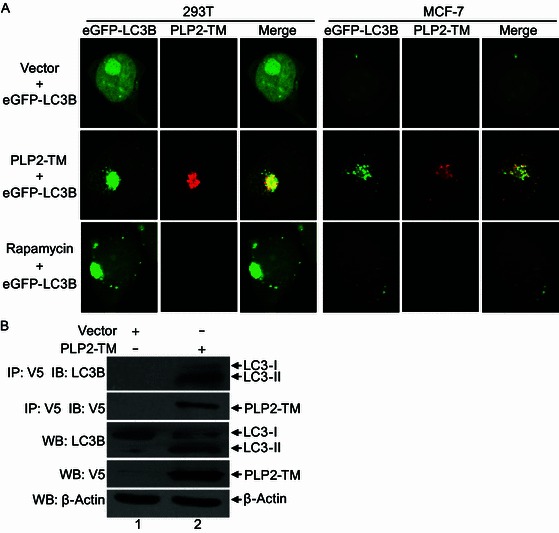
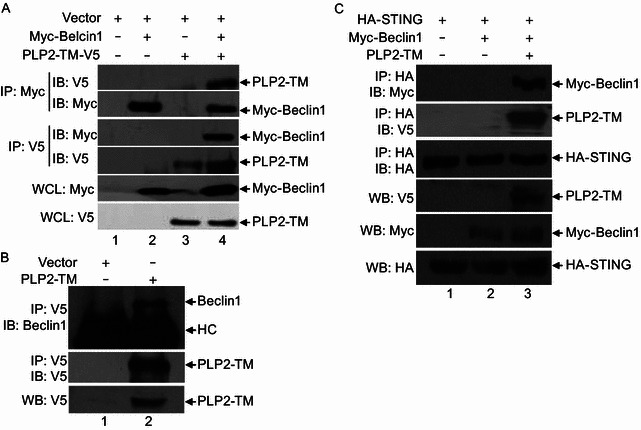
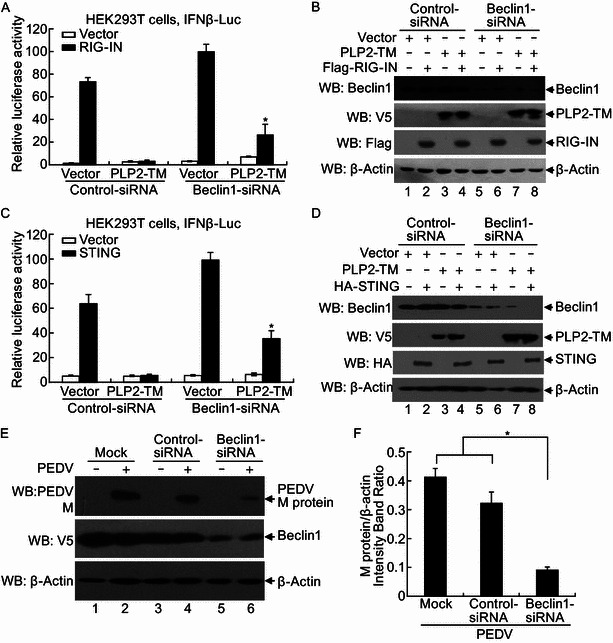
Autophagy plays important roles in modulating viral replication and antiviral immune response. Coronavirus infection is associated with the autophagic process, however, little is known about the mechanisms of autophagy induction and its contribution to coronavirus regulation of host innate responses. Here, we show that the membrane-associated papain-like protease PLP2 (PLP2-TM) of coronaviruses acts as a novel autophagy-inducing protein. Intriguingly, PLP2-TM induces incomplete autophagy process by increasing the accumulation of autophagosomes but blocking the fusion of autophagosomes with lysosomes. Furthermore, PLP2-TM interacts with the key autophagy regulators, LC3 and Beclin1, and promotes Beclin1 interaction with STING, the key regulator for antiviral IFN signaling. Finally, knockdown of Beclin1 partially reverses PLP2-TM's inhibitory effect on innate immunity which resulting in decreased coronavirus replication. These results suggested that coronavirus papain-like protease induces incomplete autophagy by interacting with Beclin1, which in turn modulates coronavirus replication and antiviral innate immunity.


Figures

Figure 1
Figure 1
PLP2-TM is a novel autophagy-inducing protein encoded by coronavirus. (A) Schematic diagram illustrating coronavirus NL63 genome, polyprotein (pp) 1a/b, the predicted processing of replicase polyproteins (pp) to nsp’s. The domains, including the predicted transmembrane (TM), in nsp3, and the membrane anchored-PLP2 construct (PLP2-TM) that were used in this study are indicated. (B) PLP2-TM is a novel autophagy-inducing protein encoded by coronavirus. The plasmid of HCoV-NL63 PLP2-TM-V5 was co-transfected with pcDNA3.1-eGFP-LC3B into HEK2923T cells. As the positive control for induction of autophagy, HEK293T cells were transfected with eGFP-LC3B for 48 h and then treated with complete medium supplemented with 400 nmol/L Rapamycin for 6 h. The immunofluoresence of the cells were detected using a confocal microscope after stained with anti-V5-tagged primary antibody, followed by being stained with Alexa Fluor 594-conjugated goat anti-rabbit secondary antibody. The localization of eGFP-LC3B positive autophagosome accumulation (green) and the V5-tagged PLPs products (anti-V5, red) was visualized using a confocal microscope. (C) Quantification of cells displaying eGFP-LC3B puncta in PLP2-TM transfected cells. HEK 293T cells were transiently co-transfected with eGFP-LC3B and PLP2-TM-expression constructs. Forty-eight hours later, cells with eGFP-LC3B puncta formation were quantificated under a fluorescence confocal microscope. Three random fields, each containing at least 80 cells, were counted. Results from one representative experiment are shown in Fig. 1B. (D) PLP2-TM induces autophagosome-like structures detected using a transmission electron microscope. HEK293T cells were transfected with pcDNA3.1 or PLP2-TM-V5 for 48 h and then cells were analyzed for autophagosome formation using a transmission electron microscope. The cells treated by 400 nmol/L Rapamycin were analyzed to serve as a positive control for induction of autophagy. Red arrows indicate representative autophagosome-like structures. N indicates the cellular nuclear. Scale bar indicates 500 nm
Figure 2
Figure 2
Autophagosome induced by CoV NL63 PLP2-TM in various cell lines. (A) PLP2-TM-V5 and pcDNA3.1-eGFP-LC3B were co-transfected respectively into HEK2923T, HeLa and MCF-7 cells. The cells were fixed at 48 h post-transfection and were analyzed for eGFP-LC3B positive autophagosome accumulation (green) using a confocal microscope as described in Fig. 1B. (B) Quantification of cells displaying eGFP-LC3B puncta from one representative experiment that shown in Fig. 2A as described in Fig. 1C. (C–E) HEK293T, HeLa and MCF-7 cells were transfectd with PLP2-TM-V5 or empty vector as a negative control for 48 h. These cells were also treated by 400 nmol/L Rapamycin to serve as a positive control for induction of autophagy. The cells were then lysed for Western blotting analysis using a rabbit anti-LC3 antibody to detect the endogenous LC3 expression (top panel in each Fig. 2C–E). The whole cell lysate (WCL) was blotted using anti-V5 antibodies to evaluate expression of PLP2-TM (middle panel in each Fig. 2C–E), and β-Actin was detected from whole cell lysate (WCL) as a loading control (bottom panel in each Fig. 2C to 2E)
Figure 3
Figure 3
Induction of autophagy by various coronaviral PLPs that is independent on the protease activity. (A) The plasmids of HCoV-NL63 PLP2-TM, SARS-CoV PLpro-TM, MERS-CoV PLpro-TM and PEDV PLP2-TM were transfected into HEK293T cells. As the positive control for induction of autophagy, HEK293T cells were treated with complete medium supplemented with 400 nmol/L Rapamycin for 6 h. The cells were then lysed for Western blotting analysis using a rabbit anti-LC3 antibody to detect endogenous LC3 expression (top panel in Fig. 3A). The whole cell lysate (WCL) was blotted using anti-V5 antibodies to evaluate expression of PLP2 (PLpro)-TM (middle panel in Fig. 3A), and β-Actin was detected in whole cell lysate (WCL) as a loading control (bottom panel in Fig. 3A). (B) PLP2-TM-V5 and the catalytic mutants (C1678A, H1836A and D1849A) as showed in Fig. 1A were transfected respectively into HEK2923T, and induction of autophagy was detected as described in Fig. 3A
Figure 4
Figure 4
PLP2-TM induces autophagy formation in a time-dependent manner. (A) Immunofluorescence microscopy was used to detect the eGFP-LC3B-autophagosome in PLP2-TM transfected cells at different time point post-transfection. The plasmid of PLP2-TM-V5 was co-transfected with pcDNA3.1-eGFP-LC3B into HEK2923T cells. The cells were fixed at 0 h, 24 h and 48 h post-transfection, respectively and then analyzed for eGFP-LC3B positive autophagosome accumulation using a confocal microscope as described in Fig. 1B. (B) Quantification of cells displaying eGFP-LC3B puncta from one representative experiment that shown in Fig. 4A as described in Fig. 1B. (C and D) HEK293T was transfected with PLP2-TM-V5 or empty vector as a negative control. At 0 h, 24 h and 48 h post-transfection, the cells were then lysed for Western blotting analysis using a rabbit anti-LC3 antibody to detect the endogenous LC3 expression (top panel in Fig. 4C). The whole cell lysate (WCL) was blotted using anti-V5 antibodies to evaluate expression of PLP2-TM (middle panel in Fig. 4C), and β-Actin was detected in whole cell lysate (WCL) as a loading control (bottom panel in Fig. 4C). The band intensity was semi-quantitated by densitometric analysis using ImageJ software. (E and F) HEK293T cells were pretreated by 250 µmol/L 3-MA, an autophagy inhibitor, for 1.5 h and then transfected with PLP2-TM or empty vector for 48 h. The LC3, PLP2-TM and β-Actin were detected and semi-quantitated as described above
Figure 5
Figure 5
PLP2-TM activates autophagosome formation but prevents its fusion with lysosomes. (A) HEK293T cells were transfected with pcDNA3.1 or PLP2-TM. As the positive control for induction of autophagy, HEK293T cells were treated with complete medium supplemented with 400 nmol/L Rapamycin for 6 h. At 48 h post-transfection, the levels of endogenous autophagic substrate p62, LC3 protein and PLP2-TM were determined using Western blot analysis. Beta-actin expression was examined as a protein loading control. (B) Diagram of mRFP-GFP-LC3 structure and the principle for probing autophagy flux with mRFP-GFP-LC3 construct. The GFP signal was easily quenched in autolysosome as the acidic pH lysosomal background because of lysosomal hydrolysis, while mRFP fluorescence existed in the acidic pH background. The merged yellow signal GFP+ mRFP+ was visualized using a confocal microscope in the autophagosomes and GFP- mRFP+ signal was visualized using a confocal microscope in the autolysosomes as described previously (Tang et al., 2013). (C) PLP2-TM activates autophagosome formation but blocks its fusion with lysosomes. HEK293T cells were co-transfected with mRFP-GFP-LC3 and PLP2-TM. As the positive control for induction of autophagy, HEK293T cells were transfected with mRFP-GFP-LC3 and then treated with complete medium supplemented with 400 nmol/L Rapamycin for 6 h. For the inhibition of autolysosome maturation, HEK293T cells were transfected with the plasmids of mRFP-GFP-LC3 and then treated with complete medium supplemented with 50 µmol/L CQ for 6 h. At 48 h post-transfection, the cells were fixed and assessed for GFP and mRFP fluorescence. Based on differential pH sensitivity of mRFP and GFP, the mRFP-GFP-LC3 probe differentiates between early, nonacidified autophagosomes (red+green+, yellow in merged images) from acidified, degradative autolysosomes (red+green, red in merged images)
Figure 6
Figure 6
PLP2-TM colocalizes and coimmunoprecipitates with autophagy marker protein LC3. (A) HEK293T and MCF-7 cells were transfectd with pcDNA3.1 empty vector, PLP2-TM-V5. After 48 h post-transfection, the cells were fixed and incubated with anti-V5-tagged primary antibody, followed by being stained with an Alexa Fluor 594-conjugated goat anti-rabbit secondary antibody. Colocalization of PLP2-TM-V5 (red) and eGFP-LC3B (green) were observed using a confocal microscope as described in Fig. 1B. (B) HEK293T cells were transfected with pcDNA3.1 empty vector or PLP2-TM-V5 for 48 h, and the cell lysate was immunoprecipitated (IP) with an anti-V5 antibody and immunoblotted (IB) with an anti-LC3 and anti-V5-tagged antibody to detect expression of LC3 (top panel) and V5-tagged PLP2-TM (second panel), respectively. The whole cell lysate (WCL) was blotted with indicated antibodies to evaluate expression of endogenous LC3 and V5-tagged PLP2-TM. Beta-actin was analyzed to serve as a protein loading control
Figure 7
Figure 7
PLP2-TM interacts with Beclin1 to promote Beclin1-STING interaction. (A) PLP2-TM interacts with exogenous Beclin1. HEK293T cells were transfected with Myc-Beclin1 and pcDNA3.1 or PLP2-TM-V5 for 48 h. The cell lysate was subjected to immunoprecipitate (IP) with an anti-Myc antibody and immunoblot (IB) with an anti-V5 and anti-Myc antibodies (upper and second panels). The cell lysate was also subjected to immunoprecipitate (IP) with an anti-V5 antibody and immunoblot (IB) with an anti-Myc and anti-V5 antibodies (the third and fourth panels). The whole cell lysate (WCL) was blotted with indicated antibodies to evaluate expression of Myc-Beclin1 and V5-tagged PLP2-TM (the fifth and bottom panels). (B) PLP2-TM is associated with endogenous Beclin1. HEK293T cells were transfected with pcDNA3.1 or PLP2-TM-V5 for 48 h. The cell lysate was prepared to immunoprecipitate (IP) with an anti-V5 antibody and immunoblot (IB) with an anti-Beclin1 and an anti-V5 antibody (upper and second panels). The whole cell lysate (WCL) was blotted with indicated antibody to evaluate expression of V5-tagged product (bottom panel). HC indicates heavy chain of immunoglobulin. (C) PLP2-TM promotes the interaction between Beclin1 and STING. HEK293T cells were co-transfected with Myc-Beclin1, HA-STING and PLP2-TM-V5 for 48 h. The cell lysate was immunoprecipitated (IP) with an anti-HA antibody and immunoblotted (IB) with an anti-Myc (upper panel), anti-V5 (the second panel) and an anti-HA antibody (the third panel). The whole cell lysate (WCL) was analyzed to evaluate expression of each epitope-tagged product with the indicated antibodies (bottom panel)
Figure 8
Figure 8
Beclin1 is required for the PLP2-TM negative regulation of IFN expression and contributes to coronavirus replication. (A, C) HEK 293T cells were mock transfected or transfected with control-siRNA, and Beclin1-siRNA at a concentration of 100 nmol/L for 24 h, and then the cells were transfected with IFNβ-luc reporter, pRL-TK, with expressing construct of RIG-IN (A) or STING (C) or empty vector and PLP2-TM for another 24 h. Cells were incubated for 48 h and firefly luciferase and Renilla luciferase activities were assayed. The results were expressed as mean relative luciferase (firefly luciferase activity divided by Renilla luciferase activity) with a standard deviation from repeated experiments carried out in triplicate. For statistical analysis, the data of Vector or PLP2-TM between Beclin1 siRNA and control siRNA were subjected to unpaired, two-tailed Student’s t test using the Microsoft SPSS 12.0 software, and a P value < 0.05 or less was considered statistically significant difference. (B and D) Proteins were extracted from the cells in Fig. 8A (B) or Fig. 8C (D) and analyzed using Western blotting with an anti-Beclin1 antibody to visualize Beclin1 proteins (top panel) and anti-V5 antibody (second panel) to visualize the PLP2-TM construct expression. Anti-Flag (B) and anti-HA (D) antibodies were used to visualize RIG-IN and STING proteins (third panel). Beta-actin was detected using Western blotting as protein loading control (bottom panel). (E) Beclin1-siRNA reduces PEDV replication in Vero cells. Vero cells were transfected with either Beclin1 siRNA or control siRNA at a concentration of 100 nmol/L for 24 h, and then the cells were treated by PEDV at a multiplicity of infection (MOI) of 0.1 for another 24 h. Cells were incubated for 48 h and the M protein expressions were assayed using Western blotting assay. (F) The optical density of M protein band in Fig. 8E was measured by densitometric analysis using ImageJ software and then the ratio of M protein/β-actin was calculated. For statistical analysis, the data between Beclin1 siRNA and control siRNA or mock control were subjected to unpaired, two-tailed Student’s t test using the Microsoft SPSS 12.0 software, and a P value < 0.05 or less was considered statistically significant difference

Similar articles

Cited by

References

    1. Barretto N, Jukneliene D, Ratia K, Chen Z, Mesecar AD, Baker SC. The papain-like protease of severe acute respiratory syndrome coronavirus has deubiquitinating activity. Journal of virology. 2005;79:15189–15198. doi: 10.1128/JVI.79.24.15189-15198.2005. - DOI - PMC - PubMed
    1. Barth S, Glick D, Macleod KF. Autophagy: assays and artifacts. J Pathol. 2010;221:117–124. doi: 10.1002/path.2694. - DOI - PMC - PubMed
    1. Bernasconi R, Noack J, Molinari M. Unconventional roles of nonlipidated LC3 in ERAD tuning and coronavirus infection. Autophagy. 2012;8:1534–1536. doi: 10.4161/auto.21229. - DOI - PubMed
    1. Bibeau-Poirier A, Servant MJ. Roles of ubiquitination in pattern-recognition receptors and type I interferon receptor signaling. Cytokine. 2008;43:359–367. doi: 10.1016/j.cyto.2008.07.012. - DOI - PubMed
    1. Bjorkoy G, Lamark T, Brech A, Outzen H, Perander M, Overvatn A, Stenmark H, Johansen T. p62/SQSTM1 forms protein aggregates degraded by autophagy and has a protective effect on huntingtin-induced cell death. J Cell Biol. 2005;171:603–614. doi: 10.1083/jcb.200507002. - DOI - PMC - PubMed

Publication types

MeSH terms

LinkOut - more resources