. 2014 Oct 9;159(2):402-14.
doi: 10.1016/j.cell.2014.09.021.

Identification of causal genetic drivers of human disease through systems-level analysis of regulatory networks

Affiliations

Identification of causal genetic drivers of human disease through systems-level analysis of regulatory networks

James C Chen et al. Cell. .

Erratum in

Abstract

Identification of driver mutations in human diseases is often limited by cohort size and availability of appropriate statistical models. We propose a framework for the systematic discovery of genetic alterations that are causal determinants of disease, by prioritizing genes upstream of functional disease drivers, within regulatory networks inferred de novo from experimental data. We tested this framework by identifying the genetic determinants of the mesenchymal subtype of glioblastoma. Our analysis uncovered KLHL9 deletions as upstream activators of two previously established master regulators of the subtype, C/EBPβ and C/EBPδ. Rescue of KLHL9 expression induced proteasomal degradation of C/EBP proteins, abrogated the mesenchymal signature, and reduced tumor viability in vitro and in vivo. Deletions of KLHL9 were confirmed in > 50% of mesenchymal cases in an independent cohort, thus representing the most frequent genetic determinant of the subtype. The method generalized to study other human diseases, including breast cancer and Alzheimer's disease.


Figures

Figure 1
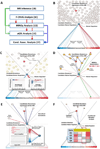
Figure 1. The general workflow of DIGGIT
(A) Overall flowchart of the DIGGIT pipeline. Green, Red, and Blue arrows indicate use of MRs, F-CNVGs, and MINDy/aQTL analysis results, respectively. (B) Step 1: Identification of candidate MRs as TFs that activate and repress over-and under-expressed genes respectively, as inferred by the MARINa algorithm. To avoid clutter, only one MR (blue circle) is represented in the panel. Grey circles represent the repertoire of genetic alterations that may be associated with the phenotype, while those within the two diagonal lines (funnel) represent alterations in pathways upstream of the MR. The red circle represents a bona-fide causal driver alteration. (C) Step 2F-CNVGs are determined by association analysis of copy number and gene-expression (see methods), thus removing a large number of genes whose expression is not affected by ploidy. The insert shows two examples: (a) An example of no dependency between copy number and expression and not selected as a candidate F-CNVG, and (b) an example with highly significant dependency and thus selected as a candidate F-CNVG (D) Step 3: MINDy analysis identifies F-CNVGs that are candidate modulators of MR-activity (shown as yellow circles), by computing the Conditional Mutual Information I[MR;T|M], where M is a candidate modulator gene and T is an ARACNe-inferred MR-target gene. Blue arrows represent physical signal transduction interactions upstream of the MR. Green arrows represent one specific M→MR→T triplet tested by MINDy, as an illustrative example. Note that MINDy does not infer the blue arrows but only the fact that a protein is an upstream modulator of MR activity. (E) Step 4: aQTL analysis identifies F-CNVGs (shown as white circles), whose alterations co-segregates with aberrant MR-activity, as computed from MR-target expression and shown by the blue arrows. The insert shows details of this analysis. The vertical gradient rectangle shows all genes sorted from the most overexpressd (red) to the most underexpressed (blue), when comparing samples with copy number alterations in a gene (Gene ×) (thick red lines) to WT samples (thin black lines). If MR-targets significantly co-segregate with the differential expression signature (i.e., if positively regulated and repressed MR targets, shown as red and blue bars, are over and under expressed, respectively, as shown), then Gene × alterations are likely to affect MR-activity. (F) Step 5: Finally, conditional association analysis identifies F-CNVGs that abrogate all other associations with the phenotype (e.g., the MES-GBM subtype) when samples harboring their alterations are removed from the analysis. Each cell shows the statistical significance of the association between the i-th gene (rows) and the phenotype of interest (as a heatmap), when considering only samples that have no alterations in the j-th gene (columns). For instance, when conditioning on G3, no other gene is significantly associated with the subtype, while G3 is still significantly associated with the subtype when conditioning on G1, G2, or G4. This suggests that G3 is a bona fide driver gene.
Figure 2
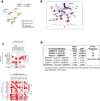
Figure 2. DIGGIT integrative analysis infers candidate MES-GBM driver mutations
(A) DIGGIT analysis of pathways upstream of MES-GBM MRs identifies CEBPδ amplification and KLHL9 deletions as candidate genetic determinants of the GBM-MES subtype. p-values shown represent the integrated p-value of the aQTL and MINDy steps, as defined in Figure 1. (B) co-mutated F-CNVGs are shown as a network, with distance between connected nodes inversely proportional to the statistical significance of their co-segregation, as assessed by Fisher’s Exact Test (FET). Only statistically significant pairs are shown (p = 0.05, corrected), with amplifications and deletions represented as blue and red nodes, respectively. Chromosome location is reported for the larger clusters, and nodes representing C/EBPδ and KLHL9 are highlighted. (C) Conditional association analysis for the two main co-segregating mutation clusters identified by DIGGIT. Color scale in the matrix cell (i,j) represents the strength of association (−log10(p)) between the i-th F-CNVG (row) and the MES subtype, conditional to removing samples with alterations in the j-th F-CNVG (column), See Fig. S3. (D) Effect size of DIGGIT-inferred genetic determinants of the MES-GBM subtype. “Classical” GBM oncogenes are shown only as a reference, for comparison purpose. Marks indicate amplification (+) deletion (−) and diploid (WT) status for each gene.
Figure 3
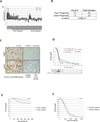
Figure 3. KLHL9 deletions are associated with aberrant C/EBPβ and C/EBPδ levels and poorest prognosis in an independent GBM cohort
(A) Genomic q-PCR analysis of primary tumors from an independent 63 GBM patient cohort, shown as CT values. Values higher than the red horizontal line (max CT threshold) represent statistically significant homozygous KLHL9 deletions (KLHL9−/−) (p ≤ 0.05). Values are reported as mean ±SEM. (B) Contingency table generated from qPCR results in panel A, showing the statistical significance of the association between KLHL9−/− alterations and poor prognosis, as assessed by FET analysis (C) IHC staining for C/EBPβ and C/EBPδ in primary samples shows stronger immunoreactivity in KHLH9−/− samples compared to KLHL9WT controls. Association between KLHL9−/− alterations and aberrant expression of C/EBP proteins is summarized by odds ratio (OR) and p-value (FET); representative IHC slides are shown. (D) Kaplan-Meier analysis of GBM samples in TCGA. Patients with KLHL9−/− and C/EBPδAmp events are shown as a red curve; proneural subtype patients are shown as a black curve; finally, KLHL9WT/CEBPδWT samples are shown as a blue curve. Kaplan-Meier p-values are shown, including p1 (red vs. blue) and p2 (red vs. black). Survival for patients with each specific genotype is shown as vertical bars below the plot. (E,F) Kaplan-Meier analysis of the association between KLHL9−/− alterations and poor prognosis in lung and serous ovarian adenocarcinoma, respectively. Analysis of inferred differential activity of C/EBPβ and C/EBPδ in KLHL9−/− samples is shown in Fig. S4.
Figure 4
Figure 4. Rescue of KLHL9 expression downregulates C/EBPβ and C/EBPδ protein abundance, as well as expression of mesenchymal marker genes
(A) KHLH9, C/EBPβ, C/EBPδ, and STAT3 protein levels in two isolated, doxycycline-inducible clones 48h after KHLH9 rescue. B-actin was used as housekeeping control gene. See Fig. S5 for additional blots (B) Densitometric quantification of the bands in 4B shows relative abundance of target proteins, including C/EBPβ/δ, AURKB, and STAT3. For each protein, values are normalized internally to BACT and then normalized again to the control. (C) GSEA analysis of ARACNe-inferred targets of C/EBPβ and C/EBPδ in genes differentially expressed following rescue of KLHL9 expression in SF210. The maximum value of the enrichment score (ES, y-axis) is used to quantify relative enrichment. A normalized enrichment score (NES) is then calculated to allow assessing the enrichment p-value (Subramanian et al., 2005). The p-value and NES shown by this graph represent the enrichment of the union of ARACNe-inferred targets of C/EBPβ and C/EBPδ that are also in the mesenchymal signature gene set (Phillips et al., 2006). Hashes in the three boxes below the plot indicate the rank of the ARACNe-inferred targets of these MRs and of other mesenchymal marker genes. Canonical mesenchymal markers are shown for reference. No significant changes in C/EBPβ and C/EBPδ mRNA levels were observed, inset.
Figure 5
Figure 5. Rescue of KLHL9 expression induces ubiquitylation and proteasomally-mediated degradation of C/EBPβ and C/EBPδ
Abbreviations: CH=cycloheximide, MG132=proteasome inhibitor. (A) Co-immunoprecipitation assays for KLHL9 and C/EBP proteins suggest direct physical interaction. (B) Treating SF210 cells with cycloheximide inhibits protein translation, thus allowing assessment of C/EBPβ, C/EBPδ protein-species turnover. The decrease in C/EBP protein half-life, following ectopic KLHL9 expression, is rescued by treatment with proteasome inhibitor, MG-132. (C) Immunoprecipitation of C/EBPβ and C/EBPδ proteins in the presence of MG-132 and subsequent analysis of ubiquitylated species by Western blot. (D) A mutant KLHL9 protein isoform that cannot interact with the Cullin ligase was engineered by deleting the KLHL9 BTB domain, as indicated in the schematic. IP assays for ubiquitylated C/EBP species were repeated following ectopic expression of mutant KLHL9. A full time course is available in Fig. S6.
Figure 6
Figure 6. Ectopic KHLH9 expression decreases cellular proliferation by imposing a late S/G2 checkpoint in human GBM cells
(A) Growth curves of SF210 cells after lentiviral-mediated expression of KLHL9 or RFP as a control; results are representative of three independent experiments. (B) Western blot analysis of asynchronous SF210 and SF763 cells after re-introduction of KLHL9, showing downregulation of C/EBP-δ and to a lesser extent C/EBP-β. Both uninfected cells and RFP infected cells are shown; β-actin serves as loading control. (C) Cell cycle profiles of KLHL9 and RFP-infected control SF763 cells synchronized by serum-free culture and then released into normal media for the indicated times. (D) BrdU incorporation by KLHL9 and RFP-infected control SF763 cells synchronized as in (c). For each time point, BrdU-labeling was performed as a 1-hour pulse preceding cell harvest. Additional data in Fig. S7.
Figure 7
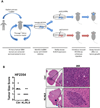
Figure 7. Ectopic KLHL9 expression, in patient-derived KLHL9−/−GBM tumors, reduces growth in orthotopic xenografts
(A) Workflow of the PDX mouse model. Primary tumor samples are retrieved from human patients and explanted into mice for propagation instead of traditional in vitro cell culture. (B) Brain sections of mice given orthotopic injections of KLHL9-rescued or RFP control human-derived GBM cells (HF2354) reveals a significant decrease in tumor number and size. Clinical scoring of tumor size from a certified pathologist indicates a statistically significant difference in tumor growth rates (p = 0.04). H&E staining of face sections reveals significantly reduced surface area of tumor masses and is also provided.

Similar articles

Cited by

References

    1. Aytes A, Mitrofanova A, Lefebvre C, Alvarez MJ, Castillo-Martin M, Zheng T, Eastham JA, Gopalan A, Pienta K, Shen MM, et al. Cross-species analysis of genome-wide regulatory networks identifies a synergistic interaction between FOXM1 and CENPF that drives prostate cancer malignancy. Cancer Cell. 2014a;25:638–651. - PMC - PubMed
    1. Aytes A, Mitrofanova A, Lefebvre C, Alvarez MJ, Castillo-Martin M, Zheng T, Eastham JA, Gopalan A, Pienta KJ, Shen MM, et al. Cross-species regulatory network analysis identifies a synergistic interaction between FOXM1 and CENPF that drives prostate cancer malignancy. Cancer Cell. 2014b;25:638–651. - PMC - PubMed
    1. Basso K, Margolin AA, Stolovitzky G, Klein U, Dalla-Favera R, Califano A. Reverse engineering of regulatory networks in human B cells. Nat Genet. 2005;37:382–390. - PubMed
    1. Brennan CW, Verhaak RG, McKenna A, Campos B, Noushmehr H, Salama SR, Zheng S, Chakravarty D, Sanborn JZ, Berman SH, et al. The somatic genomic landscape of glioblastoma. Cell. 2013;155:462–477. - PMC - PubMed
    1. Califano A, Butte AJ, Friend S, Ideker T, Schadt E. Leveraging models of cell regulation and GWAS data in integrative network-based association studies. Nat Genet. 2012;44:841–847. - PMC - PubMed

Publication types