. 2014 Oct 16;514(7522):322-7.
doi: 10.1038/nature13824. Epub 2014 Oct 5.

Clonal dynamics of native haematopoiesis

Affiliations

Clonal dynamics of native haematopoiesis

Jianlong Sun et al. Nature. .

Abstract

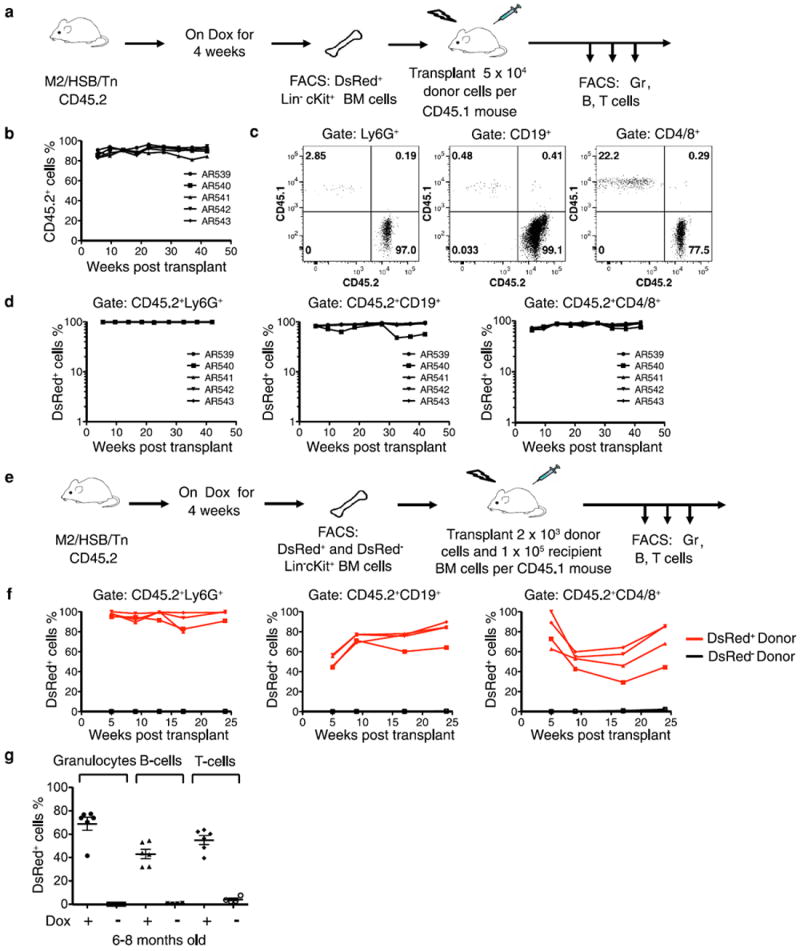
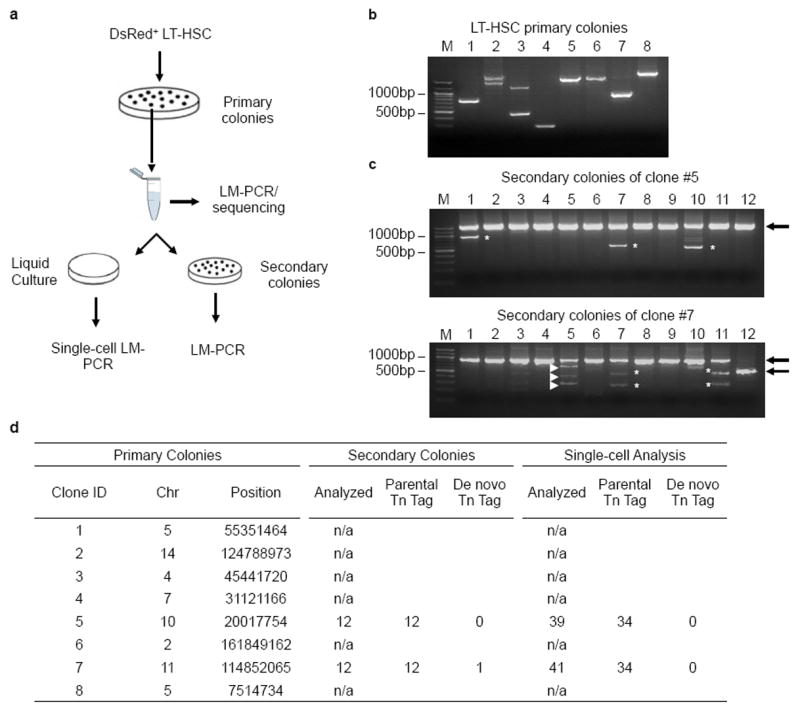
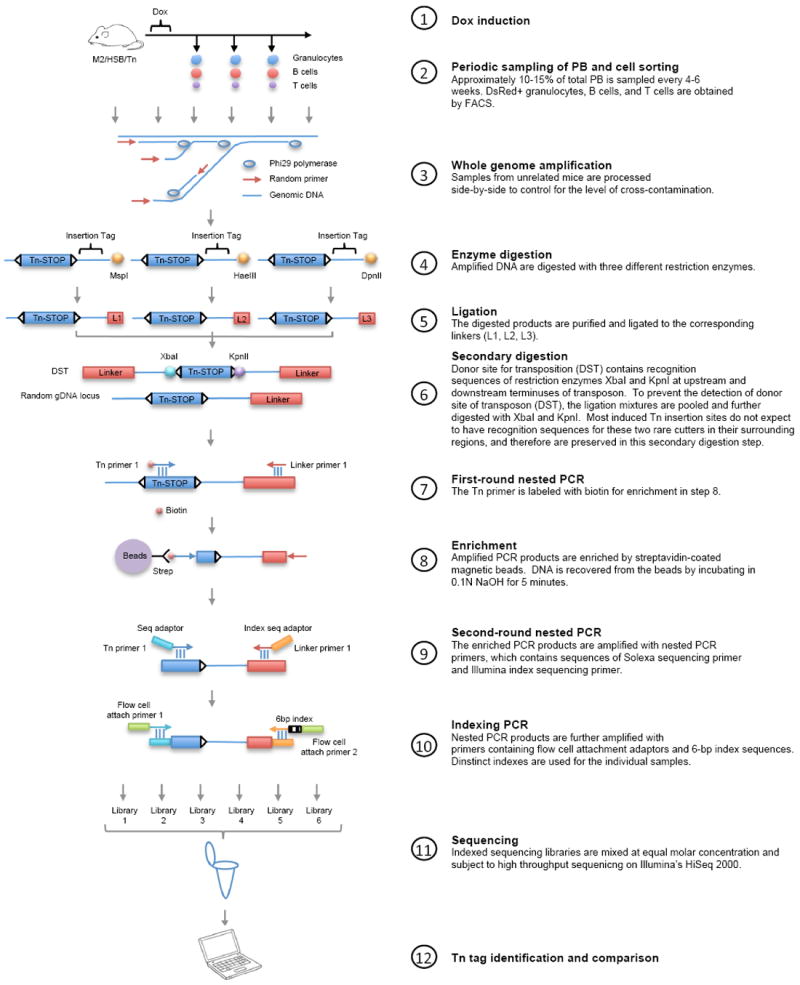
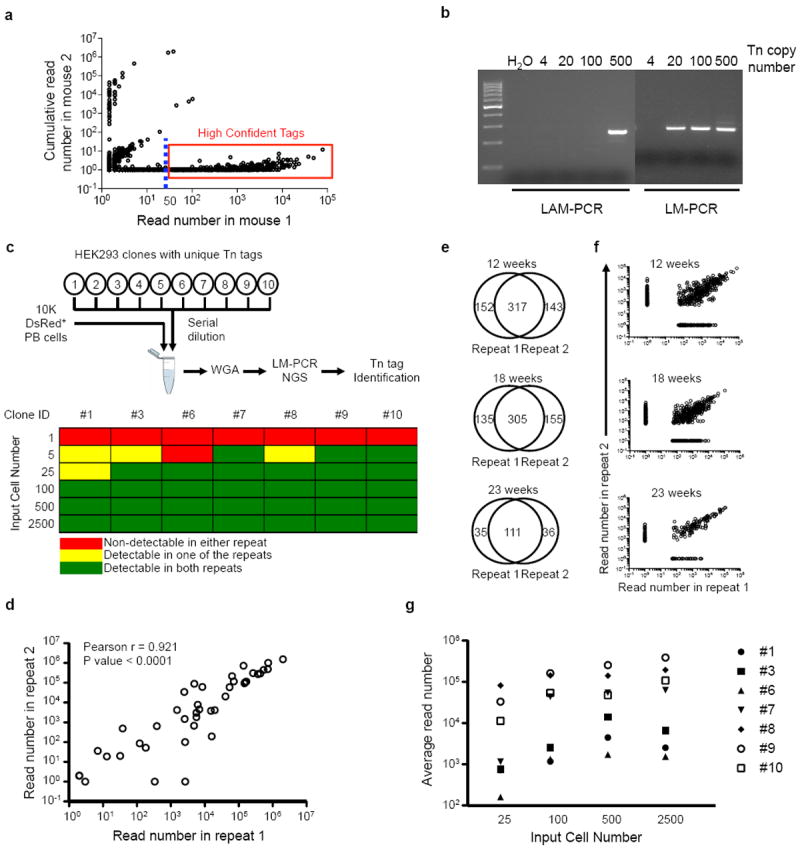
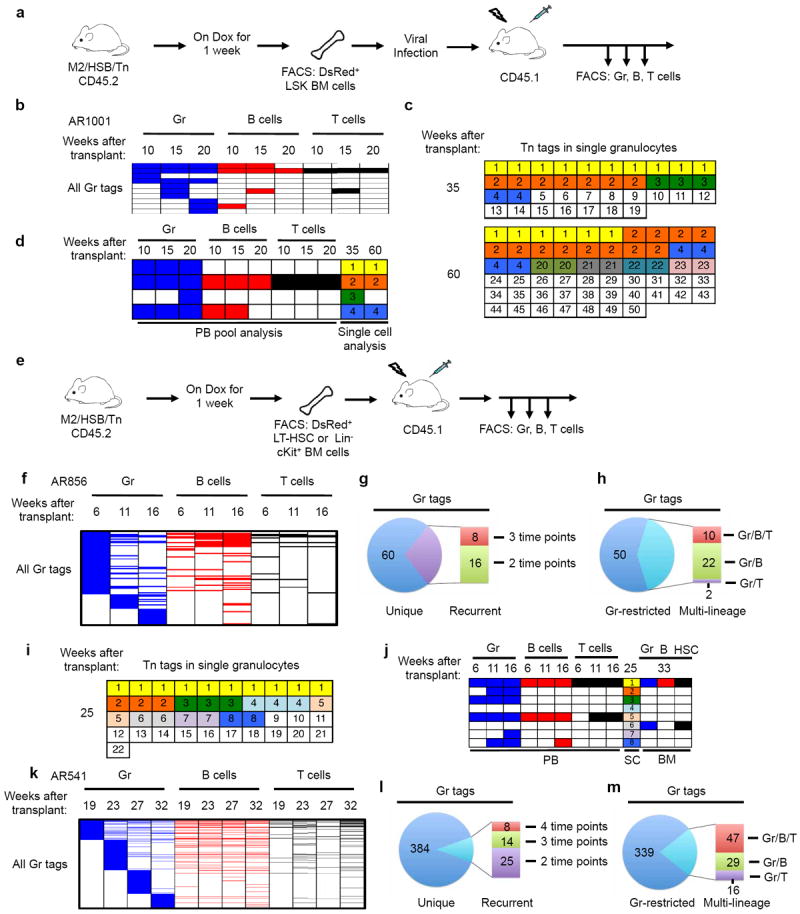
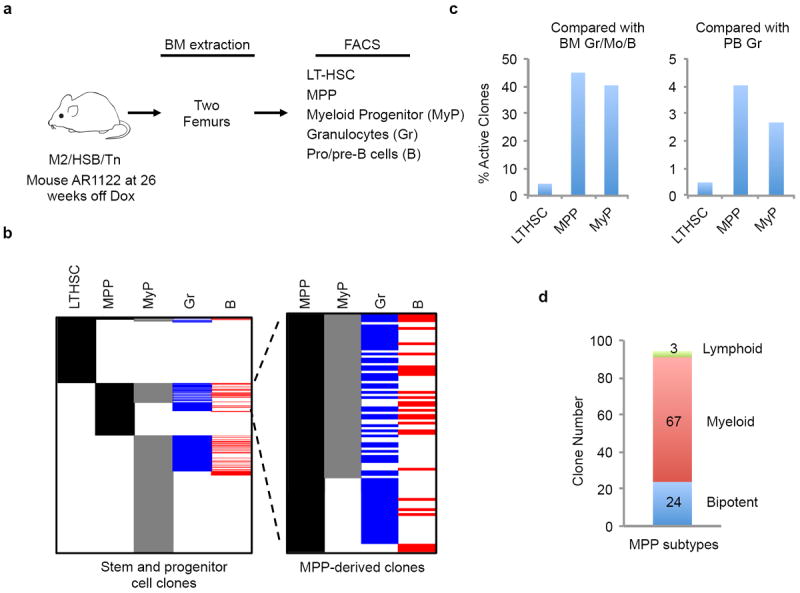
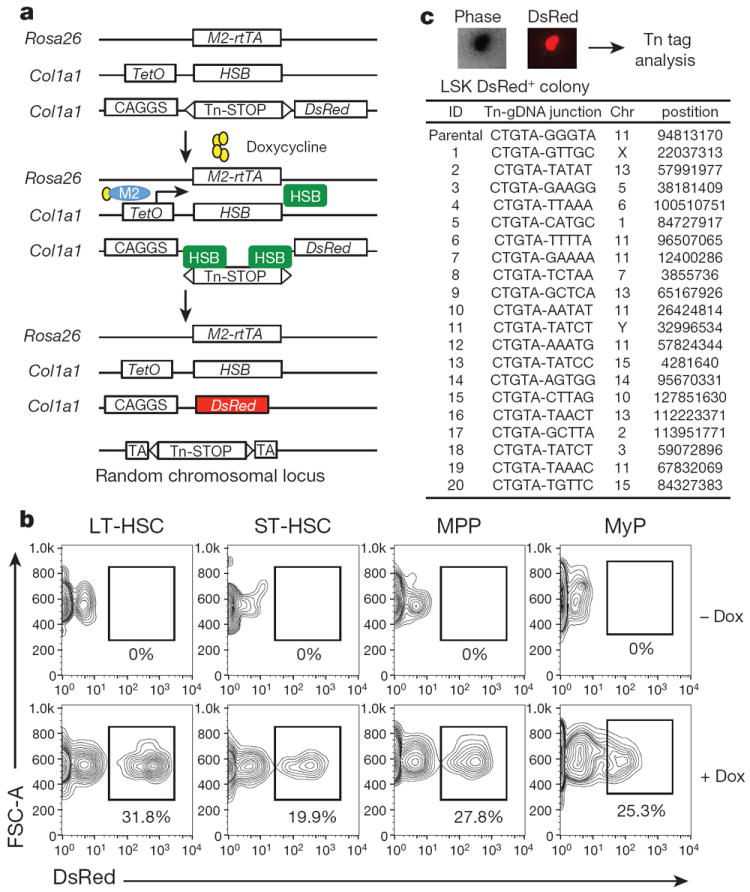
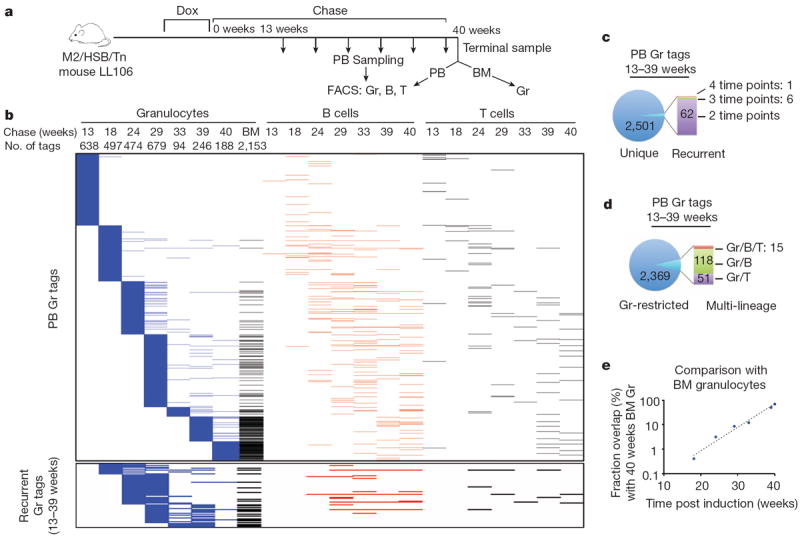
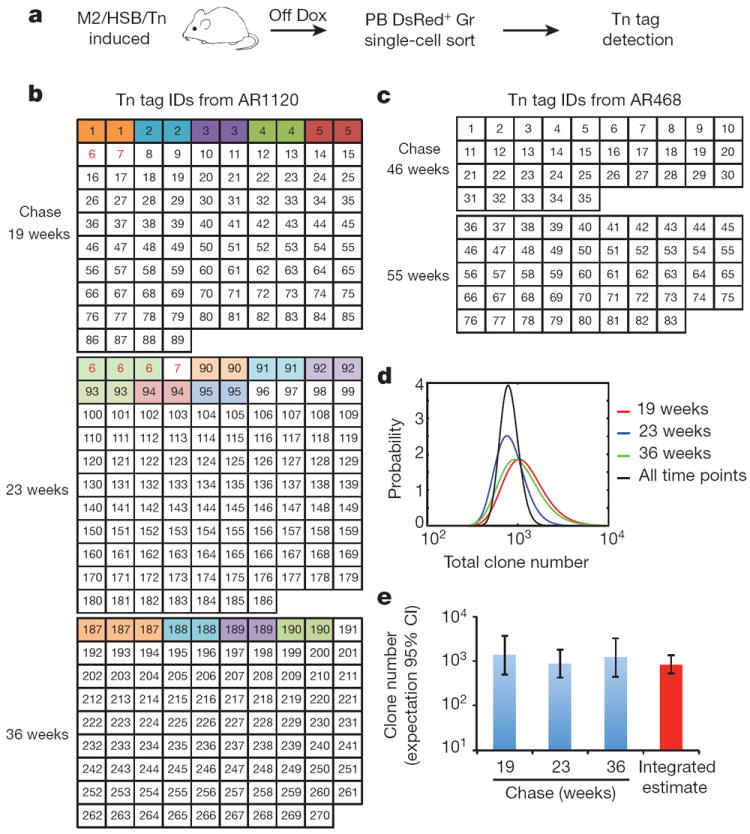
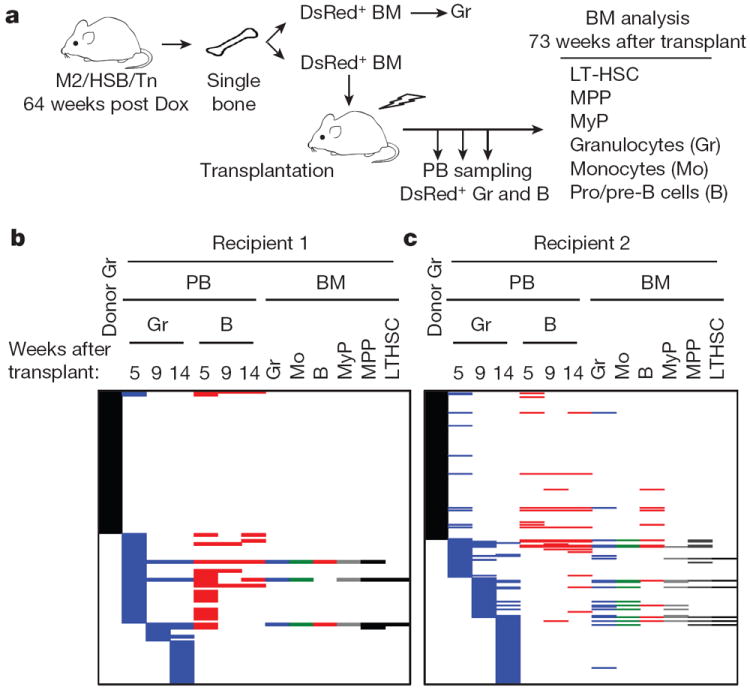
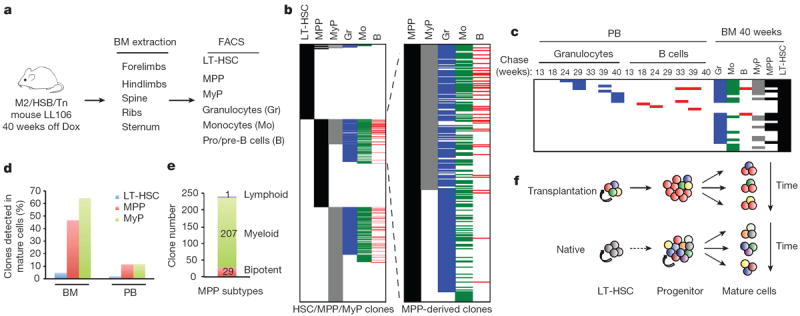
It is currently thought that life-long blood cell production is driven by the action of a small number of multipotent haematopoietic stem cells. Evidence supporting this view has been largely acquired through the use of functional assays involving transplantation. However, whether these mechanisms also govern native non-transplant haematopoiesis is entirely unclear. Here we have established a novel experimental model in mice where cells can be uniquely and genetically labelled in situ to address this question. Using this approach, we have performed longitudinal analyses of clonal dynamics in adult mice that reveal unprecedented features of native haematopoiesis. In contrast to what occurs following transplantation, steady-state blood production is maintained by the successive recruitment of thousands of clones, each with a minimal contribution to mature progeny. Our results demonstrate that a large number of long-lived progenitors, rather than classically defined haematopoietic stem cells, are the main drivers of steady-state haematopoiesis during most of adulthood. Our results also have implications for understanding the cellular origin of haematopoietic disease.


Conflict of interest statement

The authors declare no competing financial interests.

Figures

Extended Data Figure 1
Extended Data Figure 1. Characterization of M2/HSB/Tn mouse model
a, Experimental flow chart showing transplantation of DsRed+LincKit+ BM cells from induced M2/HSB/Tn mice (CD45.2+) into lethally-irradiated recipient mouse (CD45.1+). b, Longitudinal follow-up of donor-derived PB cells in 5 recipient mice. c, Representative dot blots showing percentage of donor-derived (CD45.2+) granulocyte, B cells and T cells 42.5 weeks after transplantation. d, Longitudinal follow-ups of DsRed expression in donor-derived PB granulocytes, B cells, and T cells. e, Experimental flow chart showing transplantation of DsRed+LincKit+ or DsRedLincKit+ BM cells. f, Longitudinal follow-ups of DsRed expression in donor-derived PB cells. 3 and 4 mice received DsRed and DsRed+ donor cells, respectively. g, Fraction of DsRed+ cells in PB granulocytes, B cells and T cells from 6–8-month-old induced (n = 6) and uninduced (n = 4) M2/HSB/Tn mice. Mean ± s.d. is shown.
Extended Data Figure 2
Extended Data Figure 2. Stable propagation of Tn tags during in vitro expansion of LT-HSC clones
a, Experimental flow chart showing primary and secondary colony-formation assays and Tn tag analyses. b, Results of LMPCR analysis on primary LT-HSC colonies. M, 100-bp DNA ladder. The two PCR products detected from colony no. 2 and 3 resulted from LM-PCR amplification of both ends of single Tn insertion sites. c, Results of LM-PCR analysis on secondary colonies from two of the primary colonies. Identities of the PCR products in b and c were determined by cloning and Sanger sequencing. Arrows indicate PCR products of Tn tags identified in parental colonies. Bands marked by white asterisks are PCR artefacts, which are defined by the absence of transposon element or uniquely aligned genomic DNA sequence. White arrowheads depict de novo Tn tags. d, Summary of Tn tags identified in primary colonies, secondary colonies, and single-cell analysis.
Extended Data Figure 3
Extended Data Figure 3. Flow chart showing experimental procedures of Tn tag labelling and detection
Extended Data Figure 4
Extended Data Figure 4. Characterization of methodology for Tn tag detection
a, A representative plot showing read frequencies of Tn tags detected in a test sample (shown on x axis), and their frequencies observed in control samples from an unrelated mouse (shown on y axis). Each circle represents a unique Tn tag. The dashed line depicts 50-read cutoff. Tags in the red box are high-confidence reads selected for further analysis. b, Detection sensitivity of linear amplification-mediated PCR (LAM-PCR) and ligation-mediated PCR (LM-PCR). Serial dilutions of genomic DNA from a transposon mouse are used as input. c, Sensitivity of Tn tag detection from polyclonal samples using LM-PCR. The polyclonal samples are assembled by mixing 10,000 DsRed+ PB cells and different numbers of each of ten HEK293 clones. The Tn tags in these HEK293 clones were pre-determined. Six cell dosages (1, 5, 25, 100, 500 and 2,500 cells) are tested in duplicates for each clone. A positive call for the detection of the known Tn tags is determined based on criteria defined in Supplementary Information. d, Read frequencies between the duplicate samples in c are positively correlated. Each circle depicts a Tn tag from one of the seven HEK293 clones at a particular cell dosage. e, Venn diagram showing additional technical LM-PCR repeats performed on PB Gr split samples of mouse AR1122 collected at 12, 18 and 23 weeks after Dox withdrawal. Shown in plots are the number of Tn tags that are either commonly or uniquely detected in each of the repeats. f, Plots showing read frequencies of Tn tags described in e. g, Broad distribution of read frequencies among different HEK293 clones with same input cell numbers. Averages of the duplicate samples are shown.
Extended Data Figure 5
Extended Data Figure 5. Purification of PB granulocytes, B cells, and T cells by FACS
a, Schematic for FACS purification and purity analysis of DsRed+ PB granulocytes, B cells, and T cells from induced M2/HSB/Tn mice. b, DsRed+ gates are established based on PB samples from uninduced M2/HSB/Tn mice.
Extended Data Figure 6
Extended Data Figure 6. Clonal dynamics in PB samples of additional induced mice
Data are presented in the same manner as Fig. 2. a–c, Tn tags from mouse A384; d–f, Tn tags from mouse AR1123. Tags unique to B or T cells are not shown. g–h, Tn tags from mouse AR1121. The terminal PB sample shown in panel g encompasses approximately 50% of the blood, and the BM sample are from forelimbs, hindlimbs, spine, sternum and ribs. k, The percentage of recurrent Tn tags in prior PB samples when compared with that in the BM granulocyte sample.
Extended Data Figure 7
Extended Data Figure 7. Validation of results obtained in longitudinal analyses
a, B cells and T cells Tn tags that are present in 4 or more PB samples from induced mouse LL106. b, Results of nested-PCR analysis of PB granulocytes collected from induced mouse AR446 at three time points. c, Longitudinal PB analyses of 1-day-induced mice (LL91 and LL145). d, Tn tag numbers in PB granulocytes collected from 10–16-month-old uninduced mice and from all time points shown for induced mice LL106, AR384 and AR1123.
Extended Data Figure 8
Extended Data Figure 8. Lineage relationships among BM granulocytes, monocytes and pro/pre-B cells
a, FACS plots showing purification scheme of BM granulocytes, monocytes and pro/pre-B cells. Monocytes and pro/pre-B cells are double-sorted to minimize granulocytes contamination. b, Comparison of clonal compositions of BM cell populations at different time points after Dox withdrawal. c, Percentage of granulocyte Tn tags that are shared with pro/pre-B cells. Each column represents data from an individual mouse or a single bone. d, Percentages of pro/pre B cell clones and monocyte clones that share Tn tags with BM granulocytes. Each column represents data from an individual mouse or a single bone. n/a, not available.
Extended Data Figure 9
Extended Data Figure 9. Clonal analysis of haematopoiesis under transplantation conditions
a, Experimental flow chart showing viral infection of donor cells and longitudinal analysis of clonal dynamics in the transplant mouse. 2,000 DsRed+ LSK cells were transduced with retrovirus in the presence of TPO, Flt3 and SCF for 2 days and transferred to lethally irradiated recipients in the presence of 1×10⁵ wild-type bone marrow cells. b, Distribution of PB Gr tags and their presence in B cells and T cells from recipient mouse AR1001 at three time points following transplantation. Tn tags unique to B cells or T cells are not shown. c, Single-cell analysis of PB granulocyte Tn tags from mouse AR1001 at 35 and 60 weeks after transplantation. d, A subset of dominant clones revealed in single-cell analysis (c) are stable in PB. e, Experimental flow chart showing purification and transplantation of LT-HSCs or LincKit+ BM cells from induced M2/HSB/Tn mice. 4 × 10⁴ DsRed+ LT-HSCs or 5×10⁴ DsRed+LincKit+ cells per recipient mouse were used. f–h and k–m, Distribution, recurrence, and lineage potential of PB Gr clones from recipient mouse AR856 receiving LT-HSC donor cells (f–h) and mouse AR541 receiving LincKit+ donor cells (k–m). Data are presented in the same manner as Fig. 2b–d. i, Single-cell analysis of granulocyte Tn tags from mouse AR856 25 weeks after transplantation. j, The dominant clone identified in single-cell (SC) analysis (clone no. 1 in i) is persistently detected in PB and BM from a single femur at 33 weeks. This clone is also detected in the LT-HSC compartment.
Extended Data Figure 10
Extended Data Figure 10. Analysis of lineage output by LT - HSCs in mouse AR1122
a, Schematic for clonal analyses of BM LT-HSC, multipotent progenitor (MPP), myeloerythroid progenitor (MyP), granulocytes and pro/pre-B cells. b, Comparison of identified Tn tags among different BM populations. Gr/B restricted tags are now shown. MPP-derived clones are displayed in the enlarged panel on the right. c, Percentage of LT-HSC, MPP, MyP clones that are present in BM granulocytes and pro/pre-B cells or PB granulocytes (PB Gr data are shown in Extended Data Fig. 4e). d, Subtypes of MPP clones. The lineage potential of MPP-derived clones are determined by comparing Tn tags among MPP, MyPs, granulocytes and pro/pre-B cells. Bipotent clones are those found in MPP/MyP/Gr/B, myeloid clones are MPP/Myp/Gr, and lymphoid clones are MPP/B.
Figure 1
Figure 1. Establishment of inducible transposon tagging approach
a, Transgenic alleles and strategy used for inducible genetic tagging. M2-rtTA, reverse tetracycline-responsive transcriptional activator; HSB, hyperactive Sleeping Beauty transposase; Tn, HSB transposon; STOP, polyadenylation signal; CAGGS, chicken β-actin promoter; TetO, tetracycline-response element. b, Frequency of DsRed+ cells in long-term HSC (LT-HSC), short-term HSC (ST-HSC), multipotent progenitor (MPP), and myeloid progenitors (MyP) in marrow of M2/HSB/Tn mice exposed to Dox for 3 weeks. Shown are representative FACS plots from three independently analysed mice of similar age and induction period. c, Sequence of Tn tags identified from 20 DsRed+ LSK colonies that emerged following methylcellulose culture. gDNA, genomic DNA.
Figure 2
Figure 2. Clonal dynamics of native haematopoiesis
a, Experimental flow chart showing longitudinal clonal analysis on FACS-sorted PB granulocytes (Gr), B cells, T cells, and BM Gr from induced mouse LL106. Tn tags are determined with the analysis pipeline described in Supplementary Methods. b, Distribution of Tn tags identified in PB Gr samples across multiple time points, lineages, and in BM. Each horizontal line represents a unique tag. Clones present exclusively in B cells, T cells or BM Gr are not shown. Bottom panel shows subset of PB Gr tags found in multiple time points. c, Analysis showing the number of Gr tags that are either unique or recurrent in the Gr lineage. d, Analysis of the number of Gr tags that are either Gr-restricted or shared among B/T lineages. e, Extent of clonal overlap between PB Gr tags at different time points post chase and terminal BM Gr sample. Dashed line is an exponential fit to the data.
Figure 3
Figure 3. Polyclonal and fluctuating nature of native granulopoiesis
a, Experimental flow chart for the detection of Tn tags in single PB granulocytes. b, c, Single-cell-derived Tn tags from mouse AR1120 (b) and AR468 (c) at multiple time points of chase. Numbers in each box represent unique Tn IDs detected in single cells. Colour-coded boxes depict cells with recurrent tags. Red font depicts tags found at more than one time point. The analysis was performed on two induced mice and results of both are presented here. d, Probability distribution of the total number of clones in PB Gr of AR1120 at different time points (colour curves). Black curve shows the normalized product of the probabilities from all time points. e, Predicted clone number with 95% confidence interval (CI) in PB Gr of mouse AR1120 using the data from b and d (see Methods).
Figure 4
Figure 4. Non-engraftable progenitors drive native haematopoiesis
a, Experimental flow chart used to compare clonal origins of native and recipient haematopoiesis. b, c, Tn tag analysis of cell populations from donor BM, recipient PB and recipient BM samples. Only the clones identified in granulocyte populations from donor BM and recipient PB are shown. Note stable, multilineage and HSC-derived haematopoiesis in recipients from clones not present in donor granulocytes. Two recipient mice were analysed: recipient 1 (LL109) received femur BM (b); recipient 2 (LL113) received tibia BM (c).
Figure 5
Figure 5. LT-HSCs make a limited contribution to native haematopoiesis
a, Schematic for clonal analysis of BM populations. b, Distribution of identified Tn tags in LT-HSCs, MPPs, MyPs, granulocytes, monocytes, and pro/pre-B cells. Tags present in Gr, Mo, or B but not detected in any of the progenitor populations are not shown. MPP-derived clones are displayed on the right. c, Tn tags of ‘active’ LT-HSCs clones and their presence in downstream progenitors and mature cell types in BM and longitudinal PB samples. Clones are considered active if they share their Tn tags with at least one of the differentiated cell types (BMGr/Mo/B or PB Gr/B). d, Percentage of LT-HSCs, MPPs and MyPs clones that are detected in mature cell populations in BM (Gr/Mo/B) or PB (Gr/B/T). e, Lineage distribution of MPP-derived clones. Bipotent clones have tags present in both myeloid and lymphoid lineages; myeloid-restricted MPPs share tags with at least one of the myeloid cell types, and lymphoid-restricted MPP clones are found in pro/pre-B cells only. f, Graphic representation of cellular mechanisms driving native and transplantation haematopoiesis.

Comment in

Similar articles

Cited by

References

    1. Weissman IL. Stem cells: units of development, units of regeneration, and units in evolution. Cell. 2000;100:157–168. - PubMed
    1. Kondo M, et al. Biology of hematopoietic stem cells and progenitors: implications for clinical application. Annu Rev Immunol. 2003;21:759–806. - PubMed
    1. Snippert HJ, et al. Intestinal crypt homeostasis results from neutral competition between symmetrically dividing Lgr5 stem cells. Cell. 2010;143:134–144. - PubMed
    1. Kretzschmar K, Watt FM. Lineage tracing. Cell. 2012;148:33–45. - PubMed
    1. Bystrykh LV, Verovskaya E, Zwart E, Broekhuis M, de Haan G. Counting stem cells: methodological constraints. Nature Methods. 2012;9:567–574. - PubMed

Publication types