Response and acquired resistance to everolimus in anaplastic thyroid cancer
- PMID: 25295501
- PMCID: PMC4564868
- DOI: 10.1056/NEJMoa1403352
Response and acquired resistance to everolimus in anaplastic thyroid cancer
Abstract
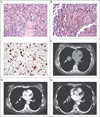
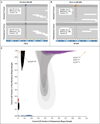
Everolimus, an inhibitor of the mammalian target of rapamycin (mTOR), is effective in treating tumors harboring alterations in the mTOR pathway. Mechanisms of resistance to everolimus remain undefined. Resistance developed in a patient with metastatic anaplastic thyroid carcinoma after an extraordinary 18-month response. Whole-exome sequencing of pretreatment and drug-resistant tumors revealed a nonsense mutation in TSC2, a negative regulator of mTOR, suggesting a mechanism for exquisite sensitivity to everolimus. The resistant tumor also harbored a mutation in MTOR that confers resistance to allosteric mTOR inhibition. The mutation remains sensitive to mTOR kinase inhibitors.
Figures


Similar articles
-
Genome sequencing identifies a basis for everolimus sensitivity.Science. 2012 Oct 12;338(6104):221. doi: 10.1126/science.1226344. Epub 2012 Aug 23. Science. 2012. PMID: 22923433 Free PMC article.
-
Next-generation sequencing reveals somatic mutations that confer exceptional response to everolimus.Oncotarget. 2016 Mar 1;7(9):10547-56. doi: 10.18632/oncotarget.7234. Oncotarget. 2016. PMID: 26859683 Free PMC article.
-
PTEN expression and mutations in TSC1, TSC2 and MTOR are associated with response to rapalogs in patients with renal cell carcinoma.Int J Cancer. 2020 Mar 1;146(5):1435-1444. doi: 10.1002/ijc.32579. Epub 2019 Aug 9. Int J Cancer. 2020. PMID: 31335987
-
Differentiating the mTOR inhibitors everolimus and sirolimus in the treatment of tuberous sclerosis complex.Neuro Oncol. 2015 Dec;17(12):1550-9. doi: 10.1093/neuonc/nov152. Epub 2015 Aug 19. Neuro Oncol. 2015. PMID: 26289591 Free PMC article. Review.
-
Everolimus tablets for patients with subependymal giant cell astrocytoma.Expert Opin Pharmacother. 2011 Oct;12(14):2265-9. doi: 10.1517/14656566.2011.601742. Epub 2011 Aug 1. Expert Opin Pharmacother. 2011. PMID: 21806479 Free PMC article. Review.
Cited by
-
Marker-free co-selection for successive rounds of prime editing in human cells.Nat Commun. 2022 Oct 7;13(1):5909. doi: 10.1038/s41467-022-33669-z. Nat Commun. 2022. PMID: 36207338 Free PMC article.
-
Implementation of a Molecular Tumor Board: The Impact on Treatment Decisions for 35 Patients Evaluated at Dartmouth-Hitchcock Medical Center.Oncologist. 2015 Sep;20(9):1011-8. doi: 10.1634/theoncologist.2015-0097. Epub 2015 Jul 23. Oncologist. 2015. PMID: 26205736 Free PMC article.
-
Pan-genomic characterization of high-risk pediatric papillary thyroid carcinoma.Endocr Relat Cancer. 2021 Apr 29;28(5):337-351. doi: 10.1530/ERC-20-0464. Endocr Relat Cancer. 2021. PMID: 33827048 Free PMC article.
-
Genomic Correlate of Exceptional Erlotinib Response in Head and Neck Squamous Cell Carcinoma.JAMA Oncol. 2015 May;1(2):238-44. doi: 10.1001/jamaoncol.2015.34. JAMA Oncol. 2015. PMID: 26181029 Free PMC article.
-
American Head and Neck Society Endocrine Surgery Section and International Thyroid Oncology Group consensus statement on mutational testing in thyroid cancer: Defining advanced thyroid cancer and its targeted treatment.Head Neck. 2022 Jun;44(6):1277-1300. doi: 10.1002/hed.27025. Epub 2022 Mar 11. Head Neck. 2022. PMID: 35274388 Free PMC article. Review.
References
-
- Davies DM, de Vries PJ, Johnson SR, et al. Sirolimus therapy for angiomyolipoma in tuberous sclerosis and sporadic lymphangioleiomyomatosis: a phase 2 trial. Clin Cancer Res. 2011;17:4071–4081. - PubMed
Publication types
MeSH terms
Substances
Grants and funding
LinkOut - more resources
Full Text Sources
Other Literature Sources
Medical
Miscellaneous
