. 2014 Oct 21;111(42):E4468-77.
doi: 10.1073/pnas.1405266111. Epub 2014 Oct 7.

CHD8 regulates neurodevelopmental pathways associated with autism spectrum disorder in neural progenitors

Affiliations

CHD8 regulates neurodevelopmental pathways associated with autism spectrum disorder in neural progenitors

Aarathi Sugathan et al. Proc Natl Acad Sci U S A. .

Abstract

Truncating mutations of chromodomain helicase DNA-binding protein 8 (CHD8), and of many other genes with diverse functions, are strong-effect risk factors for autism spectrum disorder (ASD), suggesting multiple mechanisms of pathogenesis. We explored the transcriptional networks that CHD8 regulates in neural progenitor cells (NPCs) by reducing its expression and then integrating transcriptome sequencing (RNA sequencing) with genome-wide CHD8 binding (ChIP sequencing). Suppressing CHD8 to levels comparable with the loss of a single allele caused altered expression of 1,756 genes, 64.9% of which were up-regulated. CHD8 showed widespread binding to chromatin, with 7,324 replicated sites that marked 5,658 genes. Integration of these data suggests that a limited array of direct regulatory effects of CHD8 produced a much larger network of secondary expression changes. Genes indirectly down-regulated (i.e., without CHD8-binding sites) reflect pathways involved in brain development, including synapse formation, neuron differentiation, cell adhesion, and axon guidance, whereas CHD8-bound genes are strongly associated with chromatin modification and transcriptional regulation. Genes associated with ASD were strongly enriched among indirectly down-regulated loci (P < 10(-8)) and CHD8-bound genes (P = 0.0043), which align with previously identified coexpression modules during fetal development. We also find an intriguing enrichment of cancer-related gene sets among CHD8-bound genes (P < 10(-10)). In vivo suppression of chd8 in zebrafish produced macrocephaly comparable to that of humans with inactivating mutations. These data indicate that heterozygous disruption of CHD8 precipitates a network of gene-expression changes involved in neurodevelopmental pathways in which many ASD-associated genes may converge on shared mechanisms of pathogenesis.

Keywords: CHD8; ChIP-seq; NPCs; RNA-seq; autism.


Conflict of interest statement

The authors declare no conflict of interest.

Figures
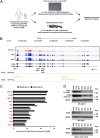
Fig. 1.
Fig. 1.
Generation and characterization of human NPC lines with stable CHD8 knockdown. (A) Schematic representation of the study design and experimental flowchart presented in the article. Following the identification of CHD8 as a strong risk factor for ASD, we characterized the transcriptional effects of CHD8 knockdown in human control NPCs and the genome-wide binding targets of CHD8. In parallel, we analyzed the in vivo phenotypes associated with chd8 suppression in zebrafish. The functional genomics output emerging from integrated analyses of these datasets is discussed in this paper. (B) CHD8 expression levels measured from RNA-seq are shown for control NPCs (blue) and stable CHD8 knock-down (KD) clones (red). Pooled tracks for all samples in each condition are presented. Track height is proportional to total library size. The locations of the different shRNA sequences used (Sh1–Sh6) are indicated at the bottom of the graph (RNA-seq row), and the epitope regions of the different CHD8 antibodies used in the ChIP-seq studies are indicated in green (ChIP-seq row). (C) Normalized expression levels of CHD8 transcript are plotted for technical (Replicate a) and biological (Replicate b) replicates as normalized expression values for convenience. FPKM, fragments per kilobase per million reads. Reduced CHD8 expression was observed in all knockdown clones. LacZb is excluded; it was removed because of insufficient reads (SI Materials and Methods). (D) Western blotting analysis of CHD8 protein levels in CHD8 stable knockdown clones for each of the three antibodies used (NB_60417, NB_60418, and Bethyl A301-224A). Two different isoforms of CHD8 protein (∼270 kDa and ∼290 kDa) were observed in the control lines (8330, GFP, and LacZ), and down-regulation of protein was observed only for CHD8 knockdown clones (Sh3, Sh4, Sh5, and Sh6). Comparable amounts of total protein were used for different samples, and HSP90 was used as loading control.
Fig. 2.
Fig. 2.
Differentially expressed genes and associated annotation terms. The heatmap shows gene expression in log2 cpm after batch correction for the 1,756 differentially expressed genes, with genes down-regulated by CHD8 knockdown (616 genes) on the bottom and genes up-regulated following CHD8 suppression (1,140 genes) on the top. Values have been centered and scaled for each row. Each row represents a single gene. Statistically significant functional annotation and pathway terms identified using DAVID (FDR < 5%) and ToppGene (Bonferroni-corrected P < 0.05) for all 1,756 differentially expressed genes are listed on the left. On the right of the heatmap, significant terms are provided for down- and up-regulated genes separately. Similar terms have been condensed and summarized for simplicity in this figure; the full list of associated terms and P values is provided in Dataset S3. The most significant terms for up-regulated genes were “chondroitin sulfate biosynthesis” (P = 2.55 × 10⁻⁶) and “mitochondrial ribosomal protein L genes” (P = 2.28 × 10⁻⁶); for down-regulated genes the most significant terms were “plasma membrane” (P = 4.31 × 10⁻¹¹), “protocadherin genes” (P = 1.16 × 10⁻¹⁰), “calcium ion binding” (P = 1.35 × 10⁻⁷), and “single organismal cell–cell adhesion” (P = 4.78 × 10⁻⁷). P values for synapse, neuron differentiation, and axon guidance among down-regulated genes ranged from 2.55 × 10⁻³ to 2.81 × 10⁻⁵ (see Dataset S3 for complete results).
Fig. 3.
Fig. 3.
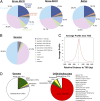
Distribution of ChIP-seq peaks from three CHD8 antibodies. (A) Genomic distribution of sequence peaks captured by each of the three antibodies, compared with the whole genome. Upstream regions are defined as regions upstream of the TSS; the 5′ UTR is the region between the TSS and the coding start site. (B) Whole-genome distribution of the genomic features in A. “Intergenic” refers to anything that does not fall into any of the preceding categories in the legend shown on the right. (C) ChIP-seq read density relative to TSSs for one representative antibody (Novus 60417). We found 7,324 peaks that were detected by all three antibodies. These peaks were mapped to 5,658 genes. (D) Distribution of chromatin states identified by the Roadmap Epigenomics consortium (21) in an ES cell-derived NPC for the whole genome (Left) and the 7,324 CHD8-binding sites detected by all three antibodies (Right).
Fig. 4.
Fig. 4.
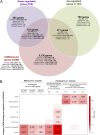
Enrichments for ASD and cancer gene sets and published BrainSpan coexpression networks among CHD8-regulated and CHD8-bound genes. (A) Gene-set enrichments are shown for the sets of genes that are both differentially expressed and bound by CHD8, differentially expressed only, or CHD8-bound only, shown as a Venn diagram. Enrichments for the set of all genes bound by CHD8, independent of differential expression, are shown outside the Venn diagram. For each set of genes in the Venn diagram, enrichment P values are shown for five disease gene lists. ORs are shown for enrichments that met P < 0.05, with asterisks indicating enrichments that met q < 0.05. Disease gene lists were obtained from SFARI and AutismKB (S/A ASD), de novo LoF mutations in ASD are from Willsey et al. (26) (Willsey ASD), TCGA gene ranker (TCGA Cancer), the pan-cancer exome sequencing study by Lawrence et al. (13) (Lawrence Cancer), and the Wellcome trust (“COSMIC Cancer”), as described in SI Materials and Methods. All gene-set analyses and Benjamini–Hochberg-corrected P values are provided in Dataset S8A. (B) For each set of CHD8-regulated or CHD8-bound genes, enrichments are shown for overlap with BrainSpan coexpression modules generated by Willsey et al. (26) and Parikshak et al. (25) that had been found to be enriched for ASD genes. The red shading in each cell corresponds to the log10 P value for enrichment, as shown in the color scale on the right. The number in each cell is the OR for enrichment, shown only if the enrichment met P < 0.05. Enrichments that met q < 0.05 are indicated by an asterisk next to the OR. Names of coexpression modules are as reported in the respective publications.
Fig. 5.
Fig. 5.
Injection of chd8 MO leads to macrocephaly, ectopic expression of HuC/D, and increased numbers of proliferating cells. (A and B) Representative images show dorsal views of an embryo injected with chd8 MO (A) and a sham-injected control (B). (C) Quantification of macrocephaly was performed in embryo batches by measuring the distance across the convex tip of the eye cups (yellow arrows) at 4.5 dpf (n = 70 embryos; repeated three times). The macrocephaly phenotype represents a 12% increase compared with controls. ***P < 0.0001 (Student t test). (D and E) Suppression of chd8 leads to increased ectopic expression of HuC/D at 2 dpf. Representative images (with HuC/D-antibody staining) show the ventral views of an embryo injected with chd8 MO and a sham-injected control. HuC/D levels in the anterior forebrain of the embryos injected with the chd8 MO are significantly higher than in controls. (F) Percentage of embryos with normal (black) or ectopic (red) HuC/D protein levels in the anterior forebrain in embryo batches injected with chd8 MO exhibit an ectopic expression of HuC/D compared with controls. (G and H) Phospho-histone H3 staining for proliferating cells in the zebrafish brain at 2 dpf. Representative images (with p-histone H3-antibody staining) show the lateral views of an embryo injected with chd8 MO and a sham-injected control. (I) Quantification of p-histone H3–positive cells from control embryos or embryos injected with chd8 MO (n = 20 embryos per group). Data are presented as the mean ± SEM. **P = 0.0018 (two-tailed t test comparisons between MO-injected and controls).

Similar articles

Cited by

References

    1. Neale BM, et al. Patterns and rates of exonic de novo mutations in autism spectrum disorders. Nature. 2012;485(7397):242–245. - PMC - PubMed
    1. O’Roak BJ, et al. Multiplex targeted sequencing identifies recurrently mutated genes in autism spectrum disorders. Science. 2012;338(6114):1619–1622. - PMC - PubMed
    1. O’Roak BJ, et al. Sporadic autism exomes reveal a highly interconnected protein network of de novo mutations. Nature. 2012;485(7397):246–250. - PMC - PubMed
    1. Sanders SJ, et al. De novo mutations revealed by whole-exome sequencing are strongly associated with autism. Nature. 2012;485(7397):237–241. - PMC - PubMed
    1. Talkowski ME, et al. Next-generation sequencing strategies enable routine detection of balanced chromosome rearrangements for clinical diagnostics and genetic research. Am J Hum Genet. 2011;88(4):469–481. - PMC - PubMed

Publication types

MeSH terms

Associated data