. 2014;15(10):476.
doi: 10.1186/s13059-014-0476-1.

Transcriptome-wide characterization of the eIF4A signature highlights plasticity in translation regulation

Affiliations

Transcriptome-wide characterization of the eIF4A signature highlights plasticity in translation regulation

Claudia A Rubio et al. Genome Biol. 2014.

Abstract

Background: Protein synthesis is tightly regulated and alterations to translation are characteristic of many cancers.Translation regulation is largely exerted at initiation through the eukaryotic translation initiation factor 4 F (eIF4F). eIF4F is pivotal for oncogenic signaling as it integrates mitogenic signals to amplify production of pro-growth and pro-survival factors. Convergence of these signals on eIF4F positions this factor as a gatekeeper of malignant fate. While the oncogenic properties of eIF4F have been characterized, genome-wide evaluation of eIF4F translational output is incomplete yet critical for developing novel translation-targeted therapies.

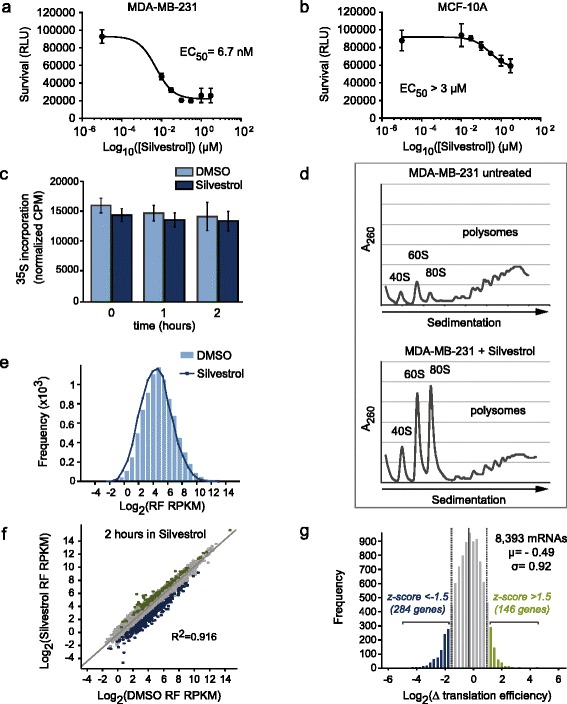
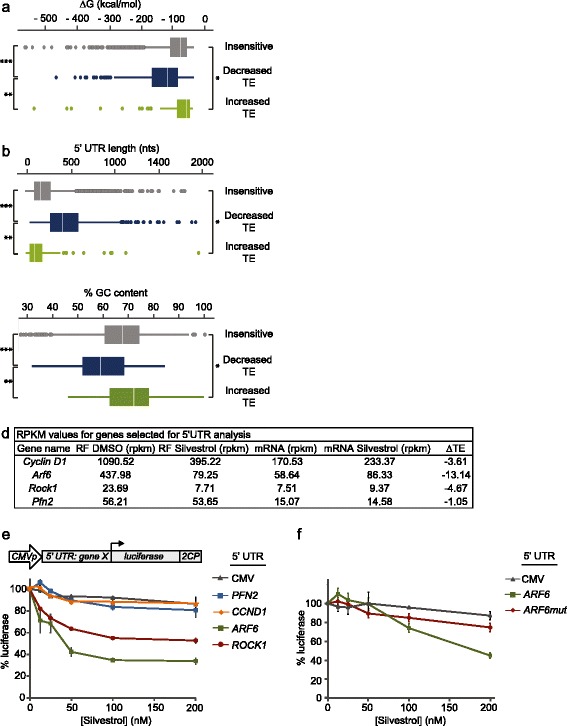
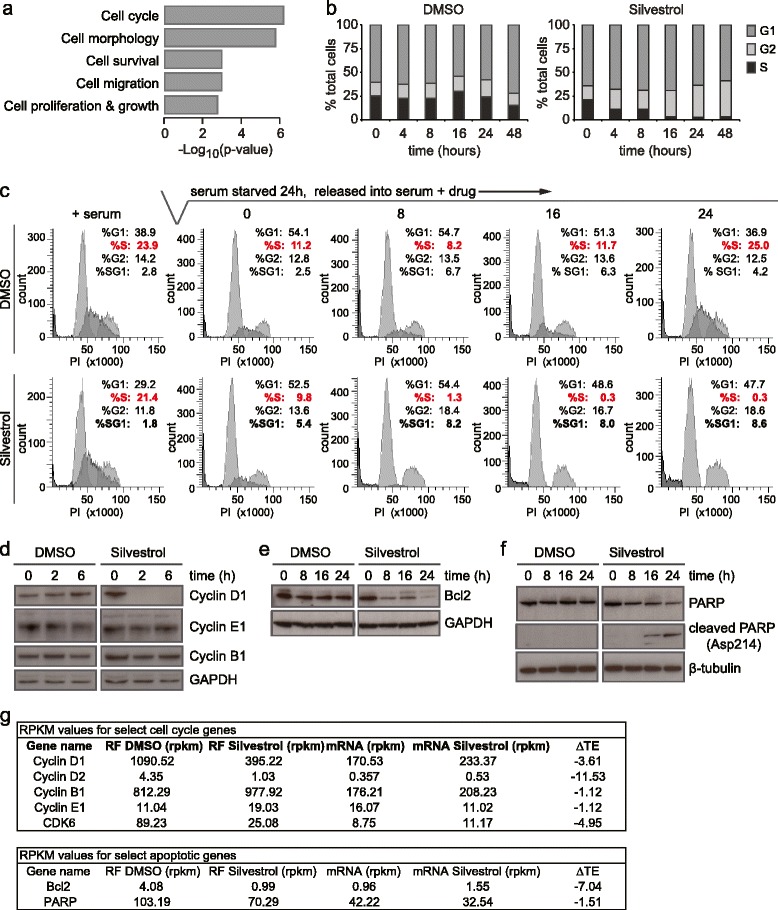
Results: To understand the impact of eIF4F on malignancy, we utilized a genome-wide ribosome profiling approach to identify eIF4F-driven mRNAs in MDA-MB-231 breast cancer cells. Using Silvestrol, a selective eIF4A inhibitor, we identify 284 genes that rely on eIF4A for efficient translation. Our screen confirmed several known eIF4F-dependent genes and identified many unrecognized targets of translation regulation. We show that 5′UTR complexity determines Silvestrol-sensitivity and altering 5′UTR structure modifies translational output. We highlight physiological implications of eIF4A inhibition, providing mechanistic insight into eIF4F pro-oncogenic activity.

Conclusions: Here we describe the transcriptome-wide consequence of eIF4A inhibition in malignant cells, define mRNA features that confer eIF4A dependence, and provide genetic support for Silvestrol’s anti-oncogenic properties. Importantly, our results show that eIF4A inhibition alters translation of an mRNA subset distinct from those affected by mTOR-mediated eIF4E inhibition. These results have significant implications for therapeutically targeting translation and underscore a dynamic role for eIF4F in remodeling the proteome toward malignancy.


Figures

Figure 1
Figure 1
eIF4A inhibition reveals genes under translational control in MDA-MB-231 cells. (a) MDA-MB-231 breast cancer cells or (b) MCF-10A non-malignant luminal breast cells were treated with increasing concentrations of Silvestrol for 72 hours. Cell proliferation was measured by lysing in Cell Titer Glow reagent and measuring luminescence in relative light units (RLU EC50 MDA-MB-231 = 6 nM; EC50 MCF-10A >3 μM. (c) MDA-MB-231 cells were treated with DMSO or 25 nM Silvestrol, pulsed with 35S-methionine for 15 minutes prior to harvest and harvested at 0, 1 or 2 hours after treatment. Bar graph represents counts per minute (CPM) normalized to total protein. Error bars represent standard error (n = 3). (d) Polysome profiles of MDA-MB-231 cells treated with DMSO (top panel; 21% ribosomal subunits and 80S monosomes, 79% polysomes; n =2) or with 25 nM Silvestrol (bottom panel; 75% ribosomal subunits and 80S monosomes, 25% polysomes; n =2) for 2 hours. A260, the absorbance of light at 260 nm. (e) Distribution of ribosome footprint (RF) RPKM values from DMSO-treated MDA-MB-231 cells (mean Log2 RPKM value =4.78) compared with Silvestrol-treated cells (mean Log2 RPKM value =4.49). RPKM = reads per kilobase per million. (f) Scatter plot of RF densities (measured in RPKM) in cells treated with 25 nM Silvestrol versus DMSO for 1 or 2 hours. Silvestrol-sensitive genes are indicated in dark blue. Correlation coefficients for biological replicates (n =2) are DMSO r =0.945 and Silvestrol r =0.977. (g) Distribution of changes in translation efficiency (TE) between DMSO- or Silvestrol-treated cells. To calculate TE, RPKM values from RF RNAs were normalized to RPKM values from mRNA sequencing results generated from identical biological samples. Silvestrol-sensitive genes with decreased TE (z-score below -1.5) and Silvestrol-resistant genes (z-score >1.5) are indicated. Population mean indicated by a solid vertical line; dotted vertical lines indicate σ values above and below the mean.
Figure 2
Figure 2
Silvestrol-sensitive mRNAs are enriched with complex 5′ UTRs. (a) Box plot showing distribution of free energy values for 5′ UTRs of Silvestrol-sensitive genes (Decreased, n =284, z-score below -1.5), genes increased in Silvestrol (n =146 genes, z-score >1.5), and genes insensitive to Silvestrol (n =6,303). ***P =2.53 × 10-67, **P =1.097 × 10-27 and *P =4.25 × 10-7. Energy values were predicted using the CONTRAfold algorithm [25]. (b) Box plot showing distribution of 5′ UTR length, L: ***P =1.39 × 10-133, **P =3.1 × 10-44 and *P =4.83 × 10-10. (c) Box plot showing distribution of GC content: ***P =1.02 × 10-47, **P =3.35 × 10-23 and *P =8.08 × 10-6. For genes with decreased TE: n =284, ∆Gmean = -103.9 kcal/mol, Lmean =493.4 nucleotides, GCmean =59.8%. For insensitive genes: n =6,303, ∆Gmean = -54.72 kcal/mol, Lmean =223.6 nucleotides, GCmean =66.9%. For genes with increased TE: n =142, ∆Gmean = -45.93 kcal/mol, Lmean =171.8 nucleotides, GCmean =71.23%. Significance values were determined using the two-tailed Mann-Whitney U test (d) RPKM and TE values from ribosome profiling data for genes used in 5′ UTR analyses of CyclinD1, ARF6, ROCK1 and PFN2. (e) Luciferase reporter constructs, stably transfected into 293 T cells, were treated with increasing concentrations of Silvestrol and luciferase expression was measured after 40 minutes; constructs bearing 5′ UTRs from Silvestrol-sensitive genes (CyclinD1, ROCK1, ARF6) or insensitive genes (PFN2 or CMV alone) were compared. Triplicate values were obtained in each experiment; data presented were obtained from four independent experiments. (f) Luciferase reporter expression in stably transfected 293 T cells treated with increasing concentrations of Silvestrol; constructs bearing ARF6wt 5′ UTR or ARF6mut 5′ UTR were compared; data presented were obtained from two independent experiments with measurements taken in triplicate.
Figure 3
Figure 3
eIF4A regulates cell cycle progression and apoptosis. (a) Gene ontology (GO) analysis predictions of the effects of Silvestrol on cancer-related pathways in MDA-MB-231 cells. (b) Cell cycle progression of MDA-MB-231 cells was monitored after treatment with DMSO (left) or Silvestrol (right) for 24 hours. Cells were pulsed with bromodeoxyuridine (BrDU) for 30 minutes prior to harvest. Upon harvest, cells were fixed, stained with anti-BrDU-fluorescein isothiocyanate (FITC) antibody and propidium iodide (PI) and analyzed by fluorescence-activated cell sorting (FACS) (c) MDA-MB-231 cells were synchronized by serum starvation for 24 hours then released from starvation in the presence of DMSO (top panels) or Silvestrol (bottom panels). The cell cycle was monitored over time by BrDU incorporation and PI staining as in Figure 3a. (d) MDA-MB-231 cells were treated with DMSO or Silvestrol for 0, 2 or 6 hours prior to lysis. Lysates were analyzed by Western blotting for proteins indicated. (e,f) MDA-MB-231 cells were treated with DMSO or Silvestrol from 0, 8, 16 and 24 hours prior to lysis; lysates were analyzed by Western blotting for indicated proteins. (g) Tables showing RPKM values from ribosome profiling data for genes implicated in cell cycle progression (top) and apoptosis (bottom).
Figure 4
Figure 4
eIF4A regulates the TE of a discrete mRNA subset with common features. (a) 5′ UTR sequences from Silvestrol-responsive genes were analyzed for secondary structure, variant 5′ UTRs and 5′ TOP sequences. Complex 5′ UTRs are defined as those with significant secondary structure (∆G < -104 kcal/mol) or annotated 5′ UTR variants. Genes with decreased TE: 37.3% structured, 38.2% variant, 2.3% 5′ TOP or 5′ TOP-like, 24.7% non-TOP and non-complex. Insensitive TE genes: 8.3% structured, 0.3% variant, 3.7% 5′ TOP or 5′ TOP-like, 88% non-TOP and non-complex. Genes with increased TE: 10.6% structured, 0% variant, 2.1% 5′ TOP or 5′ TOP-like, 87.2% non-TOP and non-complex. (b,c) PC-3 (b) or MDA-MB-231 (c) cells were treated with increasing concentrations of Silvestrol in combination with INK128 at fixed doses: 15.6 nM, 31.25 nM and 62.5 nM. Cell viability was measured by CellTiter-Glo after 3 days. (d) Distribution of changes in TE upon INK128 treatment of MDA-MB-231 cells. INK128-sensitive genes with decreased TE (z-score < -1.5) are indicated. Population mean indicated by a solid vertical line; dotted vertical lines indicate σ values above and below the mean. (e) z-scores for INK128-dependent changes in TE for known 5′ TOP mRNAs. The dotted line is drawn at z-score = -1.5. (f) 5′ UTR characteristics for genes with INK128-dependent reduction in TE; 51.2% 5′ TOP or 5′ TOP-like, 37.3% variant, 7.7% structured and 6.6% non-TOP and non-complex. (g) z-scores of transcripts in INK128-treated (left panel) or Silvestrol-treated (right panel) MDA-MB-231 cells. Each point represents a single gene; genes in orange had decreased TE in INK128 while those in blue had decreased TE in Silvestrol. Dotted lines are drawn at z-score = -1.5. (h) A model proposing that the subset of mRNAs most sensitive to eIF4A inhibition is distinct from the pool of mRNAs regulated via mTOR-mediated assembly of eIF4E and eIF4G.

Similar articles

Cited by

References

    1. Larsson O, Li S, Issaenko OA, Avdulov S, Peterson M, Smith K, Bitterman PB, Polunovsky VA. Eukaryotic translation initiation factor 4E induced progression of primary human mammary epithelial cells along the cancer pathway is associated with targeted translational deregulation of oncogenic drivers and inhibitors. Cancer Res. 2007;67:6814–6824. doi: 10.1158/0008-5472.CAN-07-0752. - DOI - PubMed
    1. Mamane Y, Petroulakis E, Martineau Y, Sato T-A, Larsson O, Rajasekhar VK, Sonenberg N. Epigenetic activation of a subset of mRNAs by eIF4E explains its effects on cell proliferation. PLoS One. 2007;2:e242. doi: 10.1371/journal.pone.0000242. - DOI - PMC - PubMed
    1. Badura M, Braunstein S, Zavadil J, Schneider RJ. DNA damage and eIF4G1 in breast cancer cells reprogram translation for survival and DNA repair mRNAs. Proc Natl Acad Sci U S A. 2012;109:18767–18772. doi: 10.1073/pnas.1203853109. - DOI - PMC - PubMed
    1. Heys SD, Park KG, McNurlan MA, Calder AG, Buchan V, Blessing K, Eremin O, Garlick PJ. Measurement of tumour protein synthesis in vivo in human colorectal and breast cancer and its variability in separate biopsies from the same tumour. Clin Sci (Lond) 1991;80:587–593. - PubMed
    1. Nathan CA, Carter P, Liu L, Li BD, Abreo F, Tudor A, Zimmer SG, De Benedetti A. Elevated expression of eIF4E and FGF-2 isoforms during vascularization of breast carcinomas. Oncogene. 1997;15:1087–1094. doi: 10.1038/sj.onc.1201272. - DOI - PubMed

Publication types

MeSH terms