Designed phosphoprotein recognition in Escherichia coli
- PMID: 25272187
- PMCID: PMC4245168
- DOI: 10.1021/cb500658w
Designed phosphoprotein recognition in Escherichia coli
Abstract
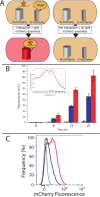
Protein phosphorylation is a central biological mechanism for cellular adaptation to environmental changes. Dysregulation of phosphorylation signaling is implicated in a wide variety of diseases. Thus, the ability to detect and quantify protein phosphorylation is highly desirable for both diagnostic and research applications. Here we present a general strategy for detecting phosphopeptide-protein interactions in Escherichia coli. We first redesign a model tetratricopeptide repeat (TPR) protein to recognize phosphoserine in a sequence-specific fashion and characterize the interaction with its target phosphopeptide in vitro. We then combine in vivo site-specific incorporation of phosphoserine with split mCherry assembly to observe the designed phosphopeptide-protein interaction specificity in E. coli. This in vivo strategy for detecting and characterizing phosphopeptide-protein interactions has numerous potential applications for the study of natural interactions and the design of novel ones.
Figures


Similar articles
-
ARPP-21, a cyclic AMP-regulated phosphoprotein (Mr = 21,000) enriched in dopamine-innervated brain regions. Amino acid sequence of the site phosphorylated by cyclic AMP in intact cells and kinetic studies of its phosphorylation in vitro.J Biol Chem. 1989 May 5;264(13):7726-33. J Biol Chem. 1989. PMID: 2540203
-
p150TSP, a conserved nuclear phosphoprotein that contains multiple tetratricopeptide repeats and binds specifically to SH2 domains.J Biol Chem. 1996 Mar 22;271(12):6952-62. doi: 10.1074/jbc.271.12.6952. J Biol Chem. 1996. PMID: 8636124
-
Encoding human serine phosphopeptides in bacteria for proteome-wide identification of phosphorylation-dependent interactions.Nat Biotechnol. 2018 Aug;36(7):638-644. doi: 10.1038/nbt.4150. Epub 2018 Jun 11. Nat Biotechnol. 2018. PMID: 29889213 Free PMC article.
-
Mechanistic insights into phosphoprotein-binding FHA domains.Acc Chem Res. 2008 Aug;41(8):991-9. doi: 10.1021/ar700148u. Epub 2008 Jul 26. Acc Chem Res. 2008. PMID: 18656966 Free PMC article. Review.
-
Lessons from nature: On the molecular recognition elements of the phosphoprotein binding-domains.Biotechnol Bioeng. 2005 Sep 5;91(5):546-55. doi: 10.1002/bit.20561. Biotechnol Bioeng. 2005. PMID: 15959902 Review.
Cited by
-
Protein design: Past, present, and future.Biopolymers. 2015 Jul;104(4):334-50. doi: 10.1002/bip.22639. Biopolymers. 2015. PMID: 25784145 Free PMC article. Review.
-
Robust production of recombinant phosphoproteins using cell-free protein synthesis.Nat Commun. 2015 Sep 9;6:8168. doi: 10.1038/ncomms9168. Nat Commun. 2015. PMID: 26350765 Free PMC article.
-
A new method for post-translationally labeling proteins in live cells for fluorescence imaging and tracking.Protein Eng Des Sel. 2017 Dec 1;30(12):771-780. doi: 10.1093/protein/gzx059. Protein Eng Des Sel. 2017. PMID: 29228311 Free PMC article.
-
Insulin receptor Thr1160 phosphorylation mediates lipid-induced hepatic insulin resistance.J Clin Invest. 2016 Nov 1;126(11):4361-4371. doi: 10.1172/JCI86013. Epub 2016 Oct 17. J Clin Invest. 2016. PMID: 27760050 Free PMC article.
-
Distinct Hepatic PKA and CDK Signaling Pathways Control Activity-Independent Pyruvate Kinase Phosphorylation and Hepatic Glucose Production.Cell Rep. 2019 Dec 10;29(11):3394-3404.e9. doi: 10.1016/j.celrep.2019.11.009. Cell Rep. 2019. PMID: 31825824 Free PMC article.
References
-
- Canagarajah B. J.; Khokhlatchev A.; Cobb M. H.; Goldsmith E. J. (1997) Activation mechanism of the MAP kinase ERK2 by dual phosphorylation. Cell 90, 859–869. - PubMed
-
- Stoothoff W. H.; Johnson G. V. W. (2005) Tau phosphorylation: physiological and pathological consequences. Biochim. Biophys. Acta 1739, 280–297. - PubMed
-
- Dhillon A. S.; Hagan S.; Rath O.; Kolch W. (2007) MAP kinase signalling pathways in cancer. Oncogene 26, 3279–3290. - PubMed
-
- Nairn A. C.; Detre J. A.; Casnellie J. E.; Greengard P. (1982) Serum antibodies that distinguish between the phospho- and dephospho-forms of a phosphoprotein. Nature 299, 734–736. - PubMed
Publication types
MeSH terms
Substances
Grants and funding
LinkOut - more resources
Full Text Sources
Other Literature Sources
Research Materials

