

Modulation of age-related insulin sensitivity by VEGF-dependent vascular plasticity in adipose tissues
- PMID: 25271320
- PMCID: PMC4205611
- DOI: 10.1073/pnas.1415825111
Modulation of age-related insulin sensitivity by VEGF-dependent vascular plasticity in adipose tissues
Abstract
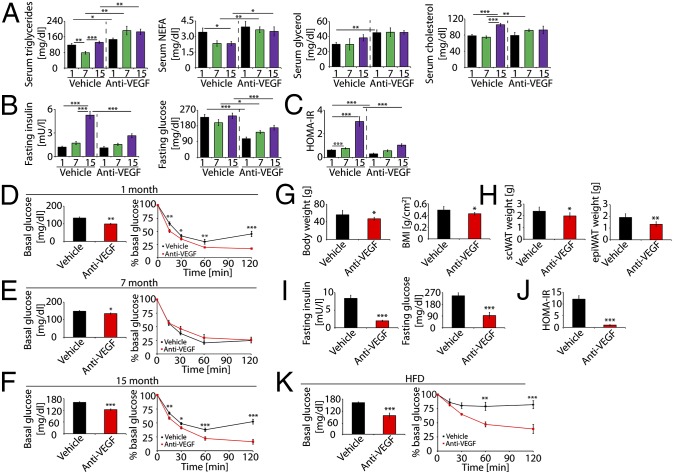
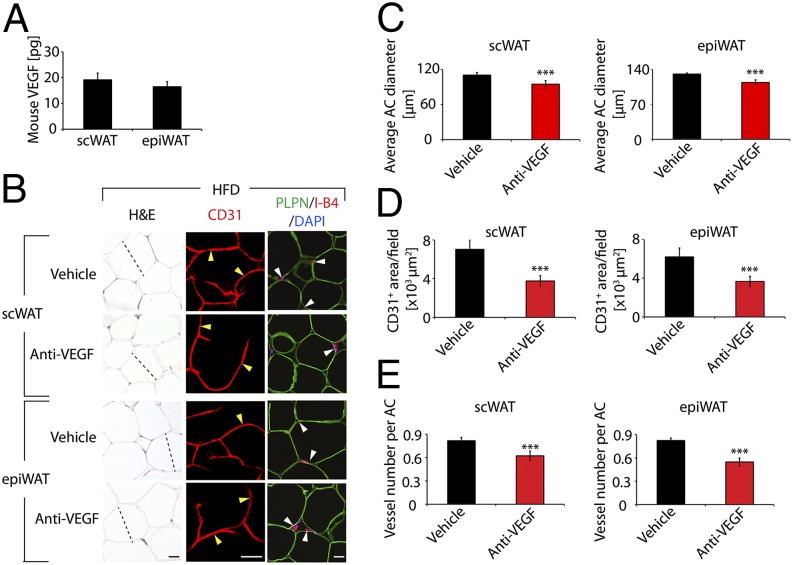
Mechanisms underlying age-related obesity and insulin resistance are generally unknown. Here, we report age-related adipose vascular changes markedly modulated fat mass, adipocyte functions, blood lipid composition, and insulin sensitivity. Notably, VEGF expression levels in various white adipose tissues (WATs) underwent changes uninterruptedly in different age populations. Anti-VEGF and anti- VEGF receptor 2 treatment in different age populations showed marked variations of vascular regression, with midaged mice exhibiting modest sensitivity. Interestingly, anti-VEGF treatment produced opposing effects on WAT adipocyte sizes in different age populations and affected vascular density and adipocyte sizes in brown adipose tissue. Consistent with changes of vasculatures and adipocyte sizes, anti-VEGF treatment increased insulin sensitivity in young and old mice but had no effects in the midaged group. Surprisingly, anti-VEGF treatment significantly improved insulin sensitivity in midaged obese mice fed a high-fat diet. Our findings demonstrate that adipose vasculatures show differential responses to anti-VEGF treatment in various age populations and have therapeutic implications for treatment of obesity and diabetes with anti-VEGF-based antiangiogenic drugs.
Keywords: aging; angiogenesis; endothelial cells; metabolic disorders; vascularization.
Conflict of interest statement
The authors declare no conflict of interest.
Figures
Similar articles
-
Dichotomous effects of VEGF-A on adipose tissue dysfunction.Proc Natl Acad Sci U S A. 2012 Apr 10;109(15):5874-9. doi: 10.1073/pnas.1200447109. Epub 2012 Mar 26. Proc Natl Acad Sci U S A. 2012. PMID: 22451920 Free PMC article.
-
Adipose tissue overexpression of vascular endothelial growth factor protects against diet-induced obesity and insulin resistance.Diabetes. 2012 Jul;61(7):1801-13. doi: 10.2337/db11-0832. Epub 2012 Apr 20. Diabetes. 2012. PMID: 22522611 Free PMC article.
-
Murine double minute-2 mediates exercise-induced angiogenesis in adipose tissue of diet-induced obese mice.Microvasc Res. 2020 Jul;130:104003. doi: 10.1016/j.mvr.2020.104003. Epub 2020 Mar 19. Microvasc Res. 2020. PMID: 32199946
-
Angiogenesis as a therapeutic target for obesity and metabolic diseases.Chem Immunol Allergy. 2014;99:170-9. doi: 10.1159/000353254. Epub 2013 Oct 17. Chem Immunol Allergy. 2014. PMID: 24217609 Review.
-
Angiogenesis and vascular functions in modulation of obesity, adipose metabolism, and insulin sensitivity.Cell Metab. 2013 Oct 1;18(4):478-89. doi: 10.1016/j.cmet.2013.08.008. Epub 2013 Sep 12. Cell Metab. 2013. PMID: 24035587 Review.
Cited by
-
Isolation of ready-made rat microvessels and its applications in effective in vivo vascularization and in angiogenic studies in vitro.Nat Protoc. 2022 Dec;17(12):2721-2738. doi: 10.1038/s41596-022-00743-1. Epub 2022 Oct 12. Nat Protoc. 2022. PMID: 36224469 Review.
-
Systems Biology Will Direct Vascular-Targeted Therapy for Obesity.Front Physiol. 2020 Jul 15;11:831. doi: 10.3389/fphys.2020.00831. eCollection 2020. Front Physiol. 2020. PMID: 32760294 Free PMC article.
-
A synergistic, balanced antioxidant cocktail, protects aging rats from insulin resistance and absence of meal-induced insulin sensitization (AMIS) syndrome.Molecules. 2015 Jan 6;20(1):669-82. doi: 10.3390/molecules20010669. Molecules. 2015. PMID: 25569521 Free PMC article. Review.
-
Age-associated downregulation of vasohibin-1 in vascular endothelial cells.Aging Cell. 2016 Oct;15(5):885-92. doi: 10.1111/acel.12497. Epub 2016 Jun 21. Aging Cell. 2016. PMID: 27325558 Free PMC article.
-
Angiogenesis-Browning Interplay Mediated by Asprosin-Knockout Contributes to Weight Loss in Mice with Obesity.Int J Mol Sci. 2022 Dec 18;23(24):16166. doi: 10.3390/ijms232416166. Int J Mol Sci. 2022. PMID: 36555807 Free PMC article.
References
-
- Facchini FS, Hua N, Abbasi F, Reaven GM. Insulin resistance as a predictor of age-related diseases. J Clin Endocrinol Metab. 2001;86(8):3574–3578. - PubMed
-
- Johnson AM, Olefsky JM. The origins and drivers of insulin resistance. Cell. 2013;152(4):673–684. - PubMed
-
- Powell K. Obesity: The two faces of fat. Nature. 2007;447(7144):525–527. - PubMed
-
- Després JP, Lemieux I. Abdominal obesity and metabolic syndrome. Nature. 2006;444(7121):881–887. - PubMed
-
- Cao Y. Adipose tissue angiogenesis as a therapeutic target for obesity and metabolic diseases. Nat Rev Drug Discov. 2010;9(2):107–115. - PubMed
Publication types
MeSH terms
Substances
LinkOut - more resources
Full Text Sources
Other Literature Sources
Medical
Molecular Biology Databases
