. 2014 Nov 15;127(Pt 22):4954-63.
doi: 10.1242/jcs.157321. Epub 2014 Sep 30.

MFN1 deacetylation activates adaptive mitochondrial fusion and protects metabolically challenged mitochondria

Affiliations

MFN1 deacetylation activates adaptive mitochondrial fusion and protects metabolically challenged mitochondria

Joo-Yong Lee et al. J Cell Sci. .

Abstract

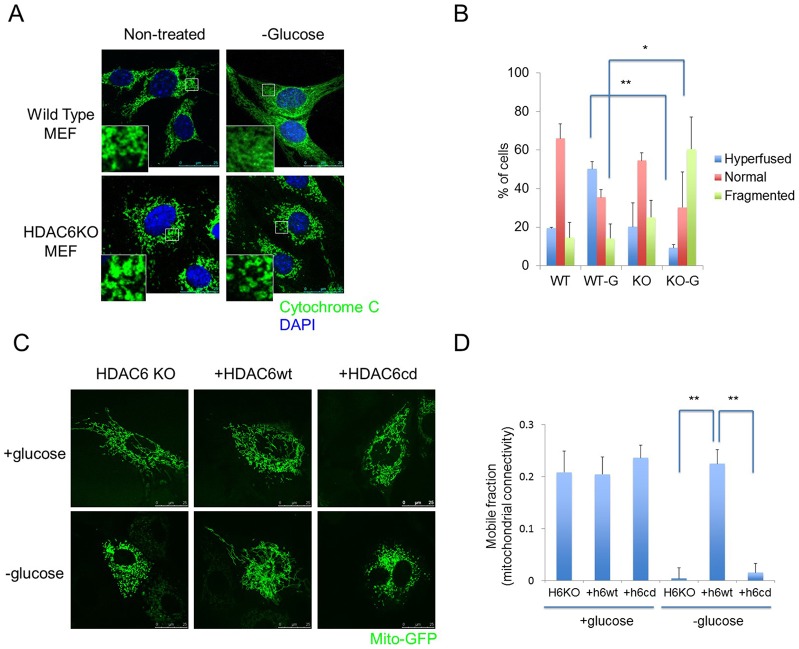
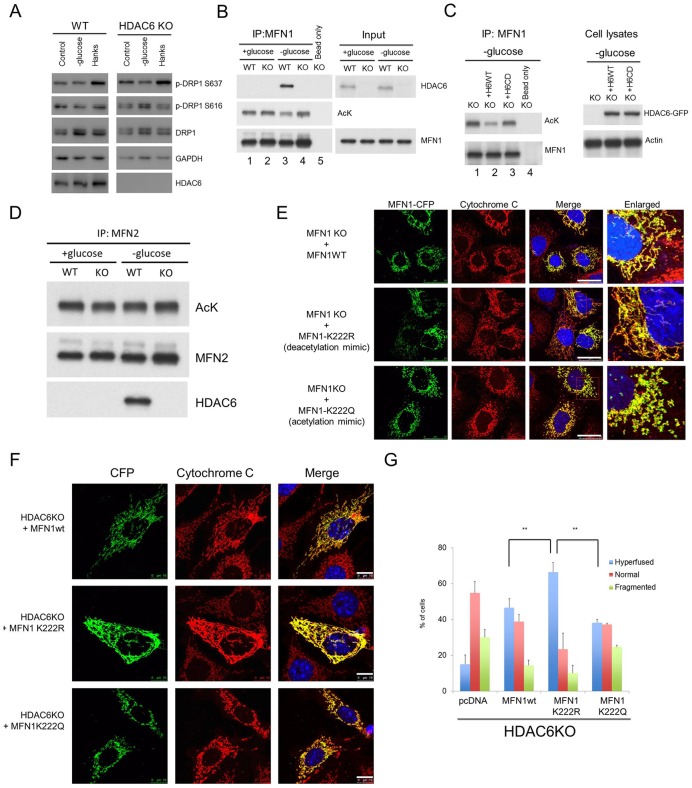
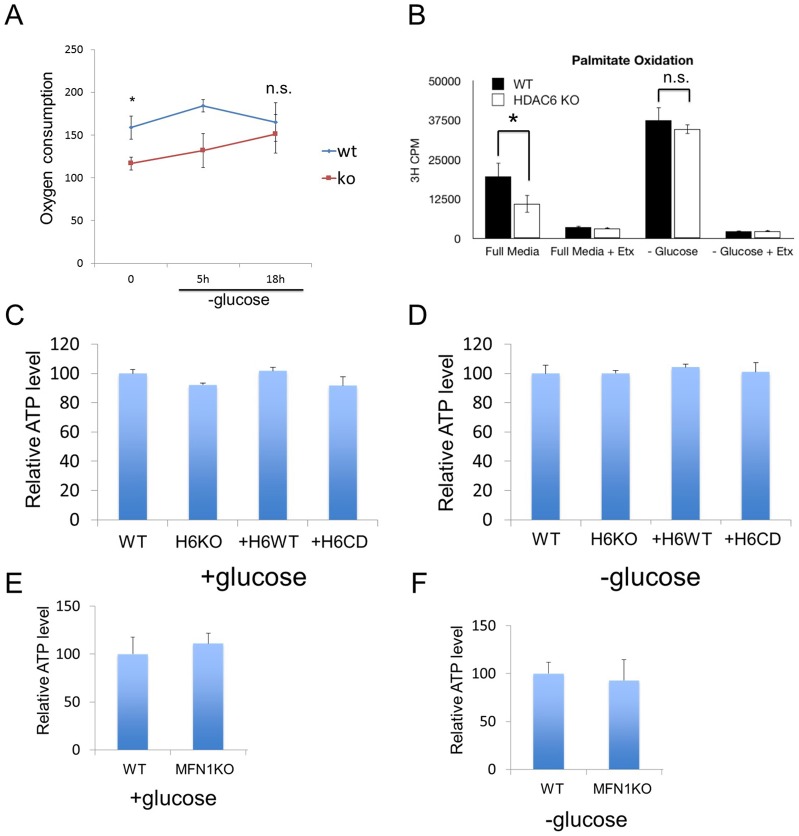
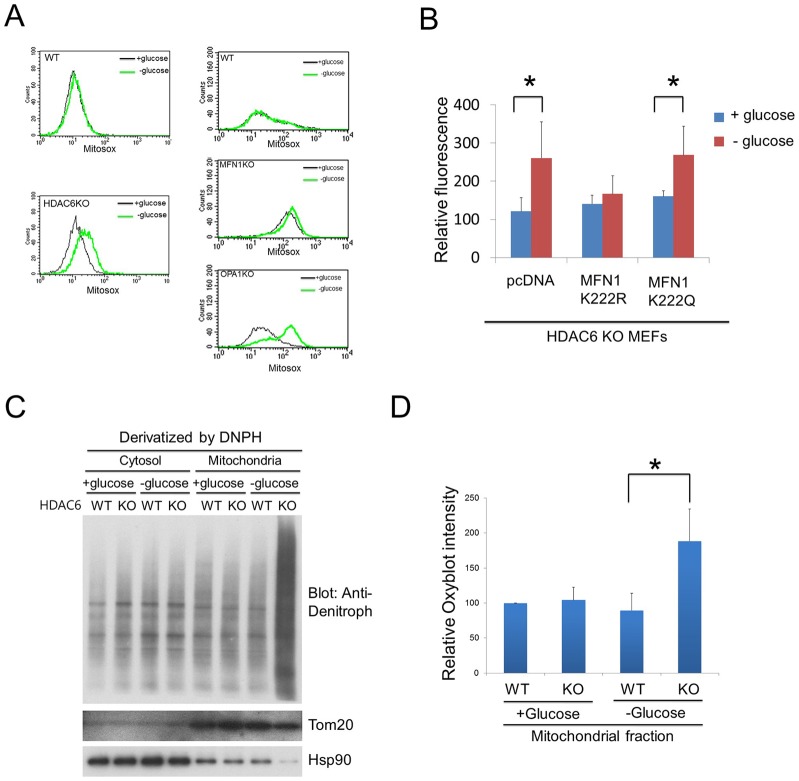
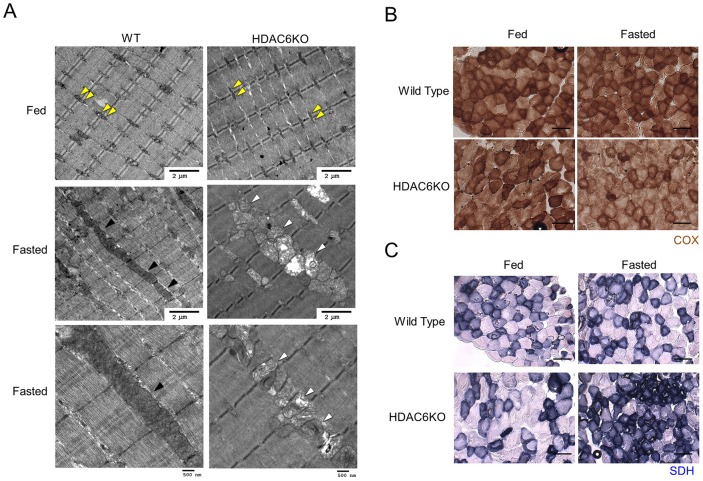
Fasting and glucose shortage activate a metabolic switch that shifts more energy production to mitochondria. This metabolic adaptation ensures energy supply, but also elevates the risk of mitochondrial oxidative damage. Here, we present evidence that metabolically challenged mitochondria undergo active fusion to suppress oxidative stress. In response to glucose starvation, mitofusin 1 (MFN1) becomes associated with the protein deacetylase HDAC6. This interaction leads to MFN1 deacetylation and activation, promoting mitochondrial fusion. Deficiency in HDAC6 or MFN1 prevents mitochondrial fusion induced by glucose deprivation. Unexpectedly, failure to undergo fusion does not acutely affect mitochondrial adaptive energy production; instead, it causes excessive production of mitochondrial reactive oxygen species and oxidative damage, a defect suppressed by an acetylation-resistant MFN1 mutant. In mice subjected to fasting, skeletal muscle mitochondria undergo dramatic fusion. Remarkably, fasting-induced mitochondrial fusion is abrogated in HDAC6-knockout mice, resulting in extensive mitochondrial degeneration. These findings show that adaptive mitochondrial fusion protects metabolically challenged mitochondria.

Keywords: Acetylation; HDAC6; MFN1; Metabolic stress; Mitochondrial fusion; ROS.


Figures

Fig. 1.
Fig. 1.
HDAC6 is required for mitochondrial fusion under glucose starvation. (A) Wild-type (WT) and HDAC6 KO MEFs were incubated with complete (non-treated) or glucose-free medium for 5 h and stained for cytochrome c (for mitochondria) and with DAPI (for nuclei). (B) Quantification of mitochondrial profiles when wild-type (WT) and HDAC6 KO MEFs were incubated in glucose-positive or -negative medium (-G). Cells with hyperfused (majority of mitochondria are interconnected), normal (mixed population of interconnected and non-connected) and hyperfragmented (majority are not connected) mitochondria were scored and presented as percentage of cells (mean±s.d.) from three independent experiments. *P<0.05; **P<0.01 (Student's t-test). (C) Representative mitochondrial images of HDAC6 KO MEFs and HDAC6 KO MEFs stably expressing wild-type (+HDAC6wt) or catalytic dead HDAC6 (+HDAC6cd) in complete (+glucose) or glucose-free (–glucose) medium. (D) Mitochondrial network connectivity in HDAC6 KO MEFs, and HDAC6 KO MEFs expressing wild-type or catalytic dead HDAC6, was measured by FRAP of mito-YFP. The mobile fraction of mito-YFP, a measure of connectivity, was determined in the indicated cell lines and represents the mean of 20 measurements (±s.e.m.). **P<0.01.
Fig. 2.
Fig. 2.
HDAC6 interacts with and deacetylates MFN1 under glucose starvation. (A) Wild-type (WT) and HDAC6 KO MEFs were incubated with complete (control) or glucose-free (−glucose) medium, or Hank's solution for 5 h and subjected to western blotting analysis using antibodies against phosphorylated DRP1 (p-DRP1) (at S637 or S616), DRP1, HDAC6 and GAPDH. (B) Wild-type and HDAC6 KO MEFs or (C) HDAC6 KO expressing HDAC6 WT or its catalytic dead (CD) mutant, were incubated with complete or glucose-free medium for 5 h, subjected to immunoprecipitation (IP) with an anti-MFN1 antibody, and blotted with antibodies for HDAC6, acetyl lysine (AcK) and MFN1 as indicated. Reconstituted HDAC6 expression was confirmed using anti-GFP and actin was used as a loading control. (D) Wild-type and HDAC6 KO MEFs were cultured in normal and glucose-free medium for 5 h and subjected to immunoprecipitation using an anti-MFN2 antibody and western blotting analysis using anti-acetyl lysine and MFN2 antibodies. (E) MFN1 KO MEFs were transfected with a plasmid expressing CFP-tagged wild-type, K222R or K222Q MFN1. At 18 h after transfection, cells were immunostained with anti-CFP (green) and anti-cytochrome-c (red) antibodies. Scale bars: 25 µm. (F) HDAC6 KO MEFs were transfected with a plasmid expressing CFP-tagged wild-type, K222R or K222Q MFN1, followed by immunostaining with anti-CFP (green) and anti-cytochrome-c (red) antibody. Scale bars: 10 µm. (G) Quantification of mitochondrial profiles after MFN1 wild-type, K222R or K222Q MFN1 overexpression in HDAC6 KO MEFs. Control or CFP-positive cells were categorized into hyperfused, normal and fragmented mitochondria, scored as percentage of cells in each category and are presented as mean±s.d. from three independent experiments. **P<0.01.
Fig. 3.
Fig. 3.
Glucose starvation-induced mitochondrial fusion is not essential for mitochondrial activities. (A) Wild-type (WT) and HDAC6 KO MEFs were incubated with complete (full, +glucose) or glucose-free medium (−glucose) for 5 or 18 h as indicated and subjected to oxygen consumption rate analysis using a Seahorse XF24 extracellular flux analyzer. Data are presented as oxygen consumption rate (±s.e.m.) from three independent assay wells. *P<0.05; n.s., not significant (Student's t-test). (B) Palmitate oxidation analysis. Data presented as the mean±s.d. of three independent experiments. Etx, Etomoxir. *P<0.05; n.s., not significant (Student's t-test). (C,D) Wild-type and HDAC6 KO MEFs, and HDAC6 KO MEFs stably expressing wild-type (+HDAC6wt) or catalytic dead HDAC6 (+HDAC6cd) were incubated with glucose-positive (C) and -negative medium (D) for 5 h and subjected to ATP analysis. Relative ATP levels were determined by comparing the mean (±s.d.) of ATP level in wild-type MEFs, which was set as 100%. (E,F) Wild-type and MFN1 KO MEFs were incubated with glucose-positive (E) and -negative medium (F) for 5 h and subjected to ATP analysis. Relative ATP levels were determined by comparing the average ATP level in wild-type MEFs. Results are mean±s.d. from three independent experiments.
Fig. 4.
Fig. 4.
Aberrant mitochondrial ROS accumulation in mitochondrial fusion-deficient cells upon glucose starvation. (A) Representative histogram of flow cytometry analysis of mitochondrial ROS with MitoSox. 3T3 immortalized wild-type (WT), HDAC6 KO and SV40 large T immortalized wild-type, MFN1 KO, OPA1 KO MEFs were incubated in complete (+glucose) or glucose-free medium (−glucose) for 5 h, stained with MitoSox and analyzed by FACS. (B) HDAC6 KO MEFs were transfected with a control plasmid (pcDNA), or expression plasmids for MFN1 K222R and MFN1 K222Q mutants using a Neon capillary transfection system. Cells were cultured in complete or glucose-free medium for 5 h, were subjected to MitoSox staining and were analyzed with a fluorescence meter (GloMax, Promega). The fluorescence value was normalized to the protein concentration after the assay. Data are presented as mean±s.d. of three independent wells. (C) Wild-type and HDAC6 KO MEFs were incubated in complete or glucose-free medium for 5 h. Cytosolic and mitochondrial fractions were subjected to an Oxyblot assay where oxidized proteins were detected by an antibody to dinitrophenyl moiety after the derivatization reaction. Hsp90 and Tom20 were used as makers for the cytosolic and mitochondrial fractions, respectively. (D) Oxyblot images were analyzed with the ImageJ program to quantify band intensity and are presented as percentage of intensity relative to the wild-type MEF +glucose sample (set at 100%). Data are the mean±s.d. of three independent experiments. *P<0.05 (Student's t-test).
Fig. 5.
Fig. 5.
HDAC6 is required for starvation-induced mitochondrial fusion in muscle. (A) Wild-type (WT) or HDAC6 KO mice were fed or subjected to 48 h of fasting. Electron microscopy was performed on longitudinal sections of tibialis anterior muscle from each condition as indicated. Yellow arrowheads show mitochondria residing in pairs on either side of the Z-disc. Black arrowheads mark fused and elongated mitochondria in fasted WT mice. White arrowheads mark unfused mitochondria in fasted HDAC6 KO mice, many of which are vacuolated. (B) Analysis of COX complex IV (brown) and (C) SDH (blue) activity in transverse tibialis anterior sections from fed or fasted WT or HDAC6 KO mice as indicated. Note the increase in SDH (blue) but decrease in COX complex IV (brown) staining in fasted HDAC6 KO muscle. Scale bars: 100 µm.

Similar articles

Cited by

References

    1. Anderson E. J., Lustig M. E., Boyle K. E., Woodlief T. L., Kane D. A., Lin C. T., Price J. W., III, Kang L., Rabinovitch P. S., Szeto H. H. et al.(2009). Mitochondrial H2O2 emission and cellular redox state link excess fat intake to insulin resistance in both rodents and humans. J. Clin. Invest. 119, 573–581 10.1172/JCI37048 - DOI - PMC - PubMed
    1. Chen H., Detmer S. A., Ewald A. J., Griffin E. E., Fraser S. E., Chan D. C. (2003). Mitofusins Mfn1 and Mfn2 coordinately regulate mitochondrial fusion and are essential for embryonic development. J. Cell Biol. 160, 189–200 10.1083/jcb.200211046 - DOI - PMC - PubMed
    1. Chen H., Vermulst M., Wang Y. E., Chomyn A., Prolla T. A., McCaffery J. M., Chan D. C. (2010). Mitochondrial fusion is required for mtDNA stability in skeletal muscle and tolerance of mtDNA mutations. Cell 141, 280–289 10.1016/j.cell.2010.02.026 - DOI - PMC - PubMed
    1. Choudhary C., Kumar C., Gnad F., Nielsen M. L., Rehman M., Walther T. C., Olsen J. V., Mann M. (2009). Lysine acetylation targets protein complexes and co-regulates major cellular functions. Science 325, 834–840 10.1126/science.1175371 - DOI - PubMed
    1. DeBerardinis R. J., Lum J. J., Thompson C. B. (2006). Phosphatidylinositol 3-kinase-dependent modulation of carnitine palmitoyltransferase 1A expression regulates lipid metabolism during hematopoietic cell growth. J. Biol. Chem. 281, 37372–37380 10.1074/jbc.M608372200 - DOI - PubMed

Publication types

LinkOut - more resources