Basal p21 controls population heterogeneity in cycling and quiescent cell cycle states
- PMID: 25267623
- PMCID: PMC4205626
- DOI: 10.1073/pnas.1409797111
Basal p21 controls population heterogeneity in cycling and quiescent cell cycle states
Abstract
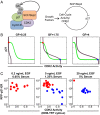
Phenotypic heterogeneity within a population of genetically identical cells is emerging as a common theme in multiple biological systems, including human cell biology and cancer. Using live-cell imaging, flow cytometry, and kinetic modeling, we showed that two states--quiescence and cell cycling--can coexist within an isogenic population of human cells and resulted from low basal expression levels of p21, a Cyclin-dependent kinase (CDK) inhibitor (CKI). We attribute the p21-dependent heterogeneity in cell cycle activity to double-negative feedback regulation involving CDK2, p21, and E3 ubiquitin ligases. In support of this mechanism, analysis of cells at a point before cell cycle entry (i.e., before the G1/S transition) revealed a p21-CDK2 axis that determines quiescent and cycling cell states. Our findings suggest a mechanistic role for p21 in generating heterogeneity in both normal tissues and tumors.
Keywords: cell dormancy; nongenetic cell heterogeneity; positive feedback loop; synthetic uORF; tumor heterogeneity.
Conflict of interest statement
The authors declare no conflict of interest.
Figures


Similar articles
-
Ubiquitination of p21Cip1/WAF1 by SCFSkp2: substrate requirement and ubiquitination site selection.Biochemistry. 2005 Nov 8;44(44):14553-64. doi: 10.1021/bi051071j. Biochemistry. 2005. PMID: 16262255
-
Estrogen-induced activation of Cdk4 and Cdk2 during G1-S phase progression is accompanied by increased cyclin D1 expression and decreased cyclin-dependent kinase inhibitor association with cyclin E-Cdk2.J Biol Chem. 1997 Apr 18;272(16):10882-94. doi: 10.1074/jbc.272.16.10882. J Biol Chem. 1997. PMID: 9099745
-
Induction of p21/WAF1 and G1 cell-cycle arrest by the chemopreventive agent apigenin.Mol Carcinog. 1997 Jun;19(2):74-82. doi: 10.1002/(sici)1098-2744(199707)19:2<74::aid-mc2>3.0.co;2-l. Mol Carcinog. 1997. PMID: 9210954
-
Inhibition of the glioblastoma cell cycle by type I IFNs occurs at both the G1 and S phases and correlates with the upregulation of p21(WAF1/CIP1).J Neurooncol. 2000 Jul;48(3):225-32. doi: 10.1023/a:1006476408190. J Neurooncol. 2000. PMID: 11100820
-
Cell cycle arrest by the isoprenoids perillyl alcohol, geraniol, and farnesol is mediated by p21(Cip1) and p27(Kip1) in human pancreatic adenocarcinoma cells.J Pharmacol Exp Ther. 2007 Mar;320(3):1163-70. doi: 10.1124/jpet.106.111666. Epub 2006 Nov 30. J Pharmacol Exp Ther. 2007. PMID: 17138864
Cited by
-
Inertial effect of cell state velocity on the quiescence-proliferation fate decision.NPJ Syst Biol Appl. 2024 Oct 2;10(1):111. doi: 10.1038/s41540-024-00428-3. NPJ Syst Biol Appl. 2024. PMID: 39358384 Free PMC article.
-
Internal Tandem Duplication in FLT3 Attenuates Proliferation and Regulates Resistance to the FLT3 Inhibitor AC220 by Modulating p21Cdkn1a and Pbx1 in Hematopoietic Cells.PLoS One. 2016 Jul 7;11(7):e0158290. doi: 10.1371/journal.pone.0158290. eCollection 2016. PLoS One. 2016. PMID: 27387666 Free PMC article.
-
Reusable rule-based cell cycle model explains compartment-resolved dynamics of 16 observables in RPE-1 cells.PLoS Comput Biol. 2024 Jan 8;20(1):e1011151. doi: 10.1371/journal.pcbi.1011151. eCollection 2024 Jan. PLoS Comput Biol. 2024. PMID: 38190398 Free PMC article.
-
Cell cycle exits and U-turns: Quiescence as multiple reversible forms of arrest.Fac Rev. 2023 Mar 8;12:5. doi: 10.12703/r/12-5. eCollection 2023. Fac Rev. 2023. PMID: 36923701 Free PMC article. Review.
-
A comprehensive model for the proliferation-quiescence decision in response to endogenous DNA damage in human cells.Proc Natl Acad Sci U S A. 2018 Mar 6;115(10):2532-2537. doi: 10.1073/pnas.1715345115. Epub 2018 Feb 20. Proc Natl Acad Sci U S A. 2018. PMID: 29463760 Free PMC article.
References
-
- Maheshri N, O’Shea EK. Living with noisy genes: How cells function reliably with inherent variability in gene expression. Annu Rev Biophys Biomol Struct. 2007;36:413–434. - PubMed
-
- Wilson A, et al. Hematopoietic stem cells reversibly switch from dormancy to self-renewal during homeostasis and repair. Cell. 2008;135(6):1118–1129. - PubMed
Publication types
MeSH terms
Substances
Grants and funding
LinkOut - more resources
Full Text Sources
Other Literature Sources
Miscellaneous

