

MicroRNA-223 coordinates cholesterol homeostasis
- PMID: 25246565
- PMCID: PMC4210029
- DOI: 10.1073/pnas.1215767111
MicroRNA-223 coordinates cholesterol homeostasis
Abstract
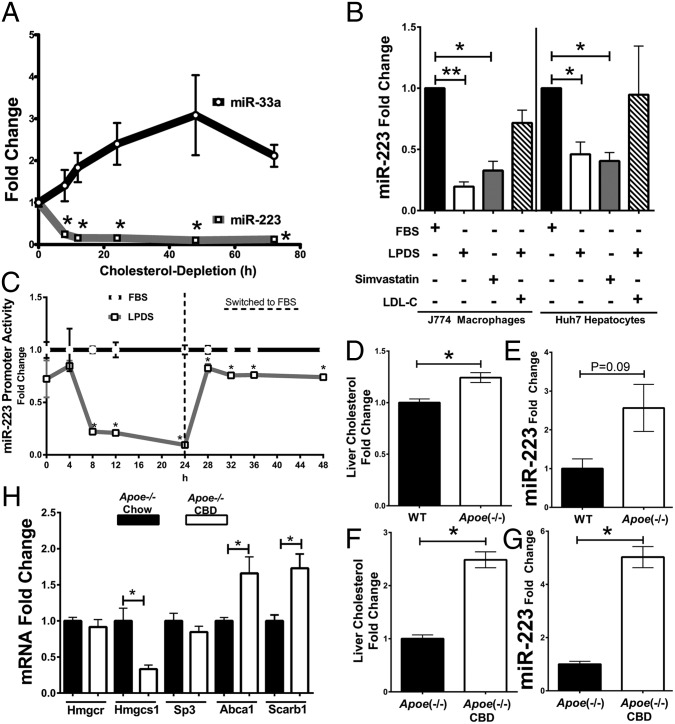
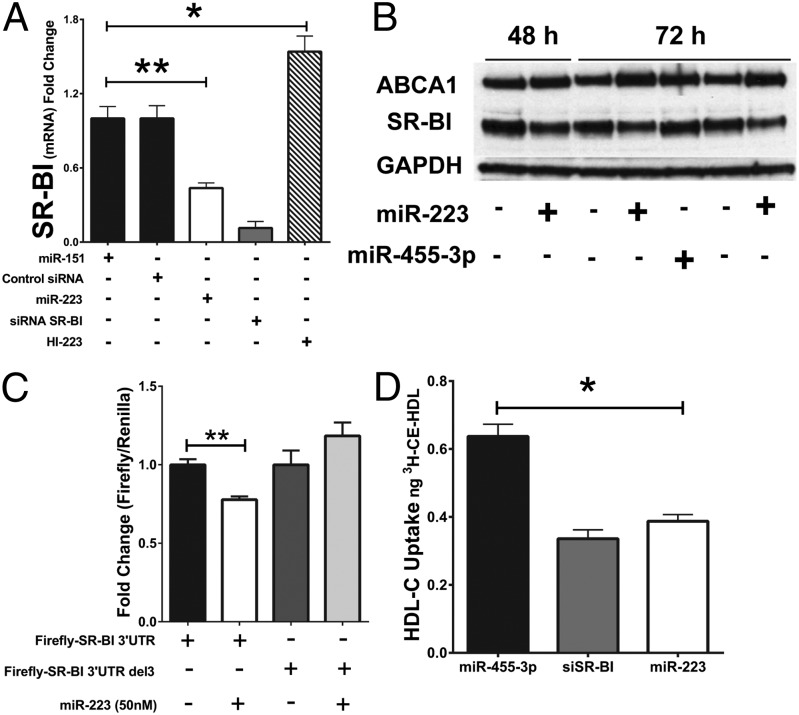
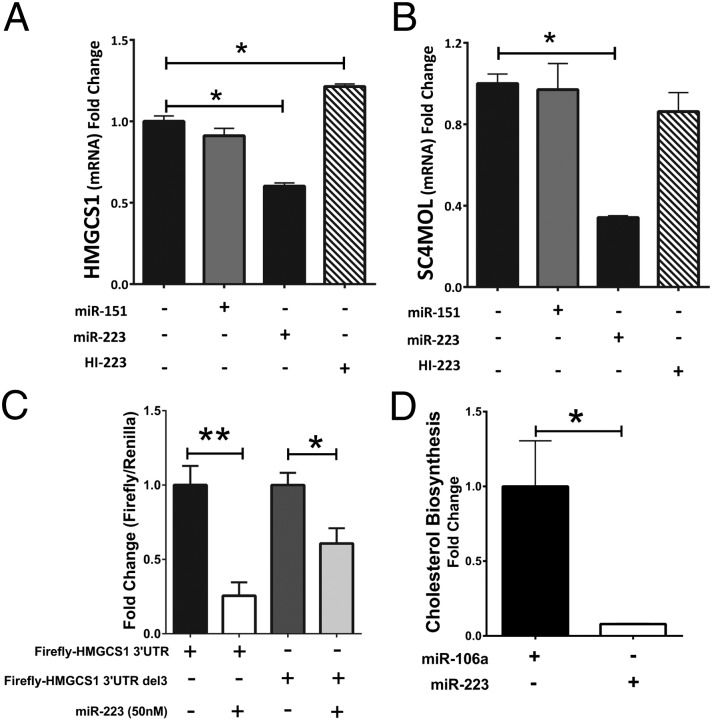
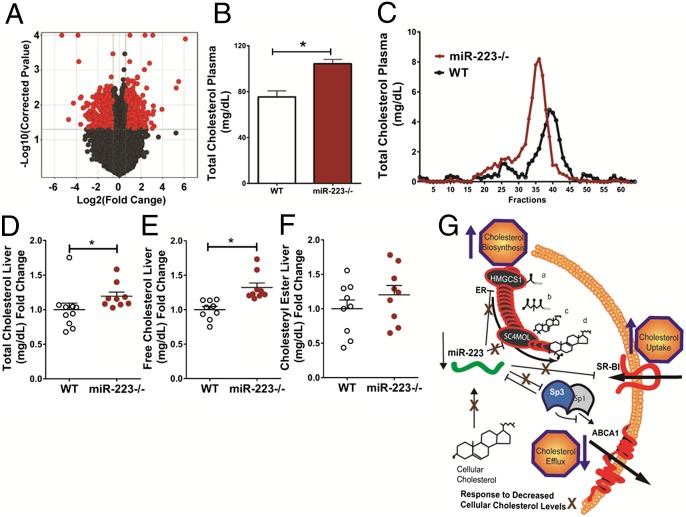
MicroRNAs (miRNAs) regulate a wide variety of biological processes and contribute to metabolic homeostasis. Here, we demonstrate that microRNA-223 (miR-223), an miRNA previously associated with inflammation, also controls multiple mechanisms associated with cholesterol metabolism. miR-223 promoter activity and mature levels were found to be linked to cellular cholesterol states in hepatoma cells. Moreover, hypercholesterolemia was associated with increased hepatic miR-223 levels in athero-prone mice. miR-223 was found to regulate high-density lipoprotein-cholesterol (HDL-C) uptake, through direct targeting and repression of scavenger receptor BI, and to inhibit cholesterol biosynthesis through the direct repression of sterol enzymes 3-hydroxy-3-methylglutaryl-CoA synthase 1 and methylsterol monooxygenase 1 in humans. Additionally, miR-223 was found to indirectly promote ATP-binding cassette transporter A1 expression (mRNA and protein) through Sp3, thereby enhancing cellular cholesterol efflux. Finally, genetic ablation of miR-223 in mice resulted in increased HDL-C levels and particle size, as well as increased hepatic and plasma total cholesterol levels. In summary, we identified a critical role for miR-223 in systemic cholesterol regulation by coordinated posttranscriptional control of multiple genes in lipoprotein and cholesterol metabolism.
Keywords: atherosclerosis; posttranscriptional gene regulation; reverse cholesterol transport.
Conflict of interest statement
The authors declare no conflict of interest.
Figures

Comment in
-
Cholesterol homeostasis regulation by miR-223: basic science mechanisms and translational implications.Circ Res. 2015 Mar 27;116(7):1112-4. doi: 10.1161/CIRCRESAHA.115.305467. Circ Res. 2015. PMID: 25814681 No abstract available.
Similar articles
-
MicroRNA-144 regulates hepatic ATP binding cassette transporter A1 and plasma high-density lipoprotein after activation of the nuclear receptor farnesoid X receptor.Circ Res. 2013 Jun 7;112(12):1602-12. doi: 10.1161/CIRCRESAHA.112.300648. Epub 2013 Mar 21. Circ Res. 2013. PMID: 23519696 Free PMC article.
-
MiR-33 contributes to the regulation of cholesterol homeostasis.Science. 2010 Jun 18;328(5985):1570-3. doi: 10.1126/science.1189862. Epub 2010 May 13. Science. 2010. PMID: 20466885 Free PMC article.
-
MicroRNA-24 aggravates atherosclerosis by inhibiting selective lipid uptake from HDL cholesterol via the post-transcriptional repression of scavenger receptor class B type I.Atherosclerosis. 2018 Mar;270:57-67. doi: 10.1016/j.atherosclerosis.2018.01.045. Epub 2018 Feb 4. Atherosclerosis. 2018. PMID: 29407889
-
microRNAs in lipoprotein metabolism and cardiometabolic disorders.Atherosclerosis. 2016 Mar;246:352-60. doi: 10.1016/j.atherosclerosis.2016.01.025. Epub 2016 Jan 18. Atherosclerosis. 2016. PMID: 26828754 Free PMC article. Review.
-
From evolution to revolution: miRNAs as pharmacological targets for modulating cholesterol efflux and reverse cholesterol transport.Pharmacol Res. 2013 Sep;75:60-72. doi: 10.1016/j.phrs.2013.02.005. Epub 2013 Feb 19. Pharmacol Res. 2013. PMID: 23435093 Free PMC article. Review.
Cited by
-
miRNAs in atherosclerotic plaque initiation, progression, and rupture.Trends Mol Med. 2015 May;21(5):307-18. doi: 10.1016/j.molmed.2015.02.003. Epub 2015 Mar 11. Trends Mol Med. 2015. PMID: 25771097 Free PMC article. Review.
-
miR-223 accelerates lipid droplets clearance in microglia following spinal cord injury by upregulating ABCA1.J Transl Med. 2024 Jul 15;22(1):659. doi: 10.1186/s12967-024-05480-5. J Transl Med. 2024. PMID: 39010173 Free PMC article.
-
Modulations of obesity-related microRNAs after exercise intervention: a systematic review and bioinformatics analysis.Mol Biol Rep. 2021 Mar;48(3):2817-2831. doi: 10.1007/s11033-021-06275-3. Epub 2021 Mar 27. Mol Biol Rep. 2021. PMID: 33772703
-
Circulating miRNA measurements are reflective of cholesterol-based changes in rainbow trout (Oncorhynchus mykiss).PLoS One. 2018 Nov 5;13(11):e0206727. doi: 10.1371/journal.pone.0206727. eCollection 2018. PLoS One. 2018. PMID: 30395627 Free PMC article.
-
MicroRNAs as a Potential Biomarker in the Diagnosis of Cardiovascular Diseases.Medicina (Kaunas). 2023 Jul 19;59(7):1329. doi: 10.3390/medicina59071329. Medicina (Kaunas). 2023. PMID: 37512140 Free PMC article. Review.
References
-
- Espenshade PJ, Hughes AL. Regulation of sterol synthesis in eukaryotes. Annu Rev Genet. 2007;41:401–427. - PubMed
-
- Brown MS, Goldstein JL. Sterol regulatory element binding proteins (SREBPs): Controllers of lipid synthesis and cellular uptake. Nutr Rev. 1998;56(2 Pt 2):S1–S3, discussion S54–S75. - PubMed
-
- Bartel DP. MicroRNAs: Genomics, biogenesis, mechanism, and function. Cell. 2004;116(2):281–297. - PubMed
Publication types
MeSH terms
Substances
Grants and funding
LinkOut - more resources
Full Text Sources
Other Literature Sources
Medical
Molecular Biology Databases
