Centromere strength provides the cell biological basis for meiotic drive and karyotype evolution in mice
- PMID: 25242031
- PMCID: PMC4189972
- DOI: 10.1016/j.cub.2014.08.017
Centromere strength provides the cell biological basis for meiotic drive and karyotype evolution in mice
Abstract
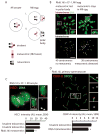
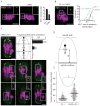
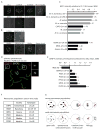
Mammalian karyotypes (number and structure of chromosomes) can vary dramatically over short evolutionary time frames. There are examples of massive karyotype conversion, from mostly telocentric (centromere terminal) to mostly metacentric (centromere internal), in 10(2)-10(5) years. These changes typically reflect rapid fixation of Robertsonian (Rb) fusions, a common chromosomal rearrangement that joins two telocentric chromosomes at their centromeres to create one metacentric. Fixation of Rb fusions can be explained by meiotic drive: biased chromosome segregation during female meiosis in violation of Mendel's first law. However, there is no mechanistic explanation of why fusions would preferentially segregate to the egg in some populations, leading to fixation and karyotype change, while other populations preferentially eliminate the fusions and maintain a telocentric karyotype. Here we show, using both laboratory models and wild mice, that differences in centromere strength predict the direction of drive. Stronger centromeres, manifested by increased kinetochore protein levels and altered interactions with spindle microtubules, are preferentially retained in the egg. We find that fusions preferentially segregate to the polar body in laboratory mouse strains when the fusion centromeres are weaker than those of telocentrics. Conversely, fusion centromeres are stronger relative to telocentrics in natural house mouse populations that have changed karyotype by accumulating metacentric fusions. Our findings suggest that natural variation in centromere strength explains how the direction of drive can switch between populations. They also provide a cell biological basis of centromere drive and karyotype evolution.
Copyright © 2014 Elsevier Ltd. All rights reserved.
Figures


Comment in
-
Genetic conflicts: stronger centromeres win tug-of-war in female meiosis.Curr Biol. 2014 Oct 6;24(19):R966-8. doi: 10.1016/j.cub.2014.08.053. Curr Biol. 2014. PMID: 25291640
Similar articles
-
Quantitative analysis of Robertsonian chromosomes inherited by descendants from multiple Rb heterozygotes of Mus m. Domesticus.Front Cell Dev Biol. 2022 Nov 25;10:1050556. doi: 10.3389/fcell.2022.1050556. eCollection 2022. Front Cell Dev Biol. 2022. PMID: 36506103 Free PMC article.
-
Tracking Chromosomal Origins in the Northern Italy System of Metacentric Races of the House Mouse.Cytogenet Genome Res. 2022;162(4):214-230. doi: 10.1159/000527106. Epub 2022 Dec 1. Cytogenet Genome Res. 2022. PMID: 36455542
-
Holokinetic drive: centromere drive in chromosomes without centromeres.Evolution. 2014 Aug;68(8):2412-20. doi: 10.1111/evo.12437. Epub 2014 May 22. Evolution. 2014. PMID: 24758327
-
Cell Biology of Cheating-Transmission of Centromeres and Other Selfish Elements Through Asymmetric Meiosis.Prog Mol Subcell Biol. 2017;56:377-396. doi: 10.1007/978-3-319-58592-5_16. Prog Mol Subcell Biol. 2017. PMID: 28840246 Review.
-
The Robertsonian phenomenon in the house mouse: mutation, meiosis and speciation.Chromosoma. 2014 Dec;123(6):529-44. doi: 10.1007/s00412-014-0477-6. Epub 2014 Jul 23. Chromosoma. 2014. PMID: 25053180 Review.
Cited by
-
Spatial Regulation of Kinetochore Microtubule Attachments by Destabilization at Spindle Poles in Meiosis I.Curr Biol. 2015 Jul 20;25(14):1835-41. doi: 10.1016/j.cub.2015.05.013. Epub 2015 Jul 9. Curr Biol. 2015. PMID: 26166779 Free PMC article.
-
Sex Differences in the Recombination Landscape.Am Nat. 2020 Feb;195(2):361-379. doi: 10.1086/704943. Epub 2019 Dec 9. Am Nat. 2020. PMID: 32017625 Free PMC article.
-
Widespread Recurrent Patterns of Rapid Repeat Evolution in the Kinetochore Scaffold KNL1.Genome Biol Evol. 2015 Aug 8;7(8):2383-93. doi: 10.1093/gbe/evv140. Genome Biol Evol. 2015. PMID: 26254484 Free PMC article.
-
Competition of Parental Genomes in Plant Hybrids.Front Plant Sci. 2020 Feb 25;11:200. doi: 10.3389/fpls.2020.00200. eCollection 2020. Front Plant Sci. 2020. PMID: 32158461 Free PMC article. Review.
-
Transmission distortion and genetic incompatibilities between alleles in a multigenerational mouse advanced intercross line.Genetics. 2022 Jan 4;220(1):iyab192. doi: 10.1093/genetics/iyab192. Genetics. 2022. PMID: 34791189 Free PMC article.
References
-
- Rieseberg LH. Chromosomal rearrangements and speciation. Trends Ecol Evol. 2001;16:351–358. - PubMed
-
- Faria R, Navarro A. Chromosomal speciation revisited: rearranging theory with pieces of evidence. Trends Ecol Evol. 2010;25:660–9. - PubMed
-
- Brown JD, O’Neill RJ. Chromosomes, conflict, and epigenetics: chromosomal speciation revisited. Annu Rev Genomics Hum Genet. 2010;11:291–316. - PubMed
-
- Britton-Davidian J, Catalan J, Ramalhinho MG, Ganem G, Auffray JC, Capela R, Biscoito M, Searle JB, Mathias ML. Rapid chromosomal evolution in island mice. Nature. 2000;403:158. - PubMed
-
- White TA, Bordewich M, Searle JB. A network approach to study karyotypic evolution: the chromosomal races of the common shrew (Sorex araneus) and house mouse (Mus musculus) as model systems. Syst Biol. 2010;59:262–76. - PubMed
Publication types
MeSH terms
Grants and funding
LinkOut - more resources
Full Text Sources
Other Literature Sources
Molecular Biology Databases

