

Energy metabolic reprogramming in the hypertrophied and early stage failing heart: a multisystems approach
- PMID: 25236884
- PMCID: PMC4241130
- DOI: 10.1161/CIRCHEARTFAILURE.114.001469
Energy metabolic reprogramming in the hypertrophied and early stage failing heart: a multisystems approach
Abstract
Background: An unbiased systems approach was used to define energy metabolic events that occur during the pathological cardiac remodeling en route to heart failure (HF).
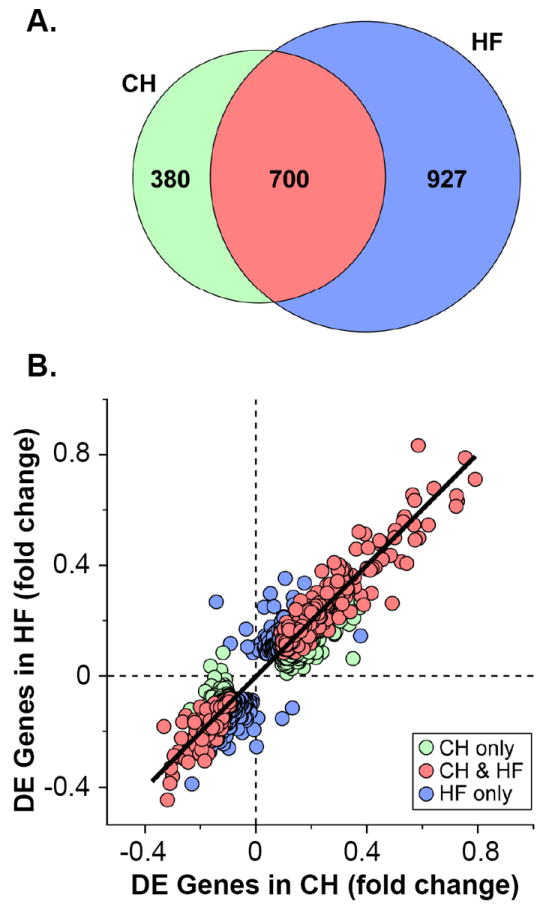
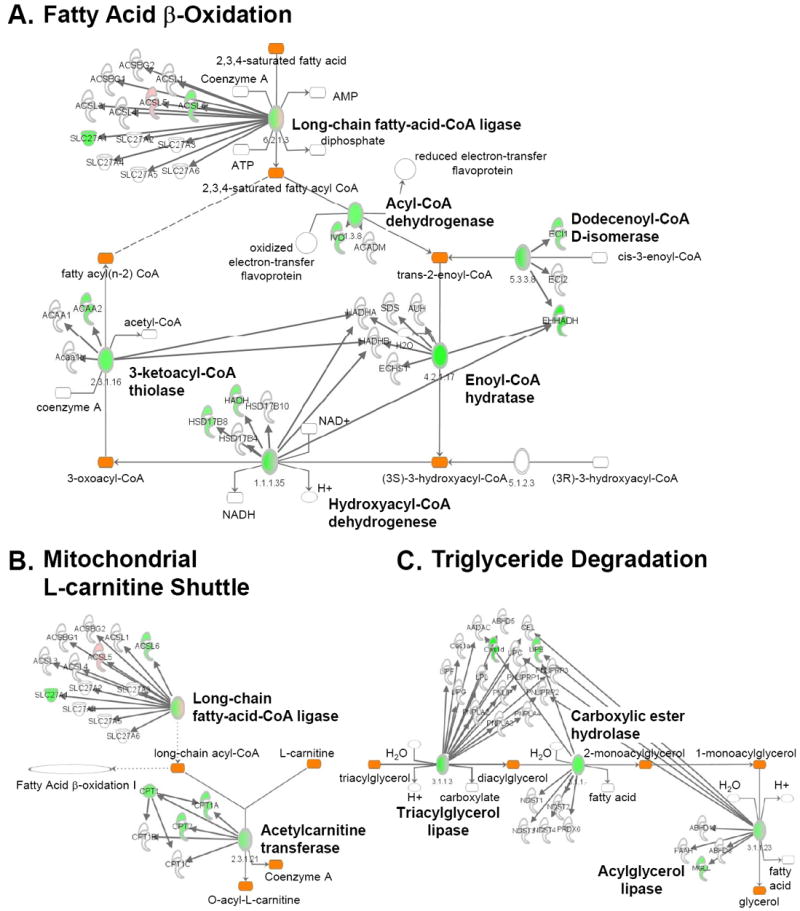
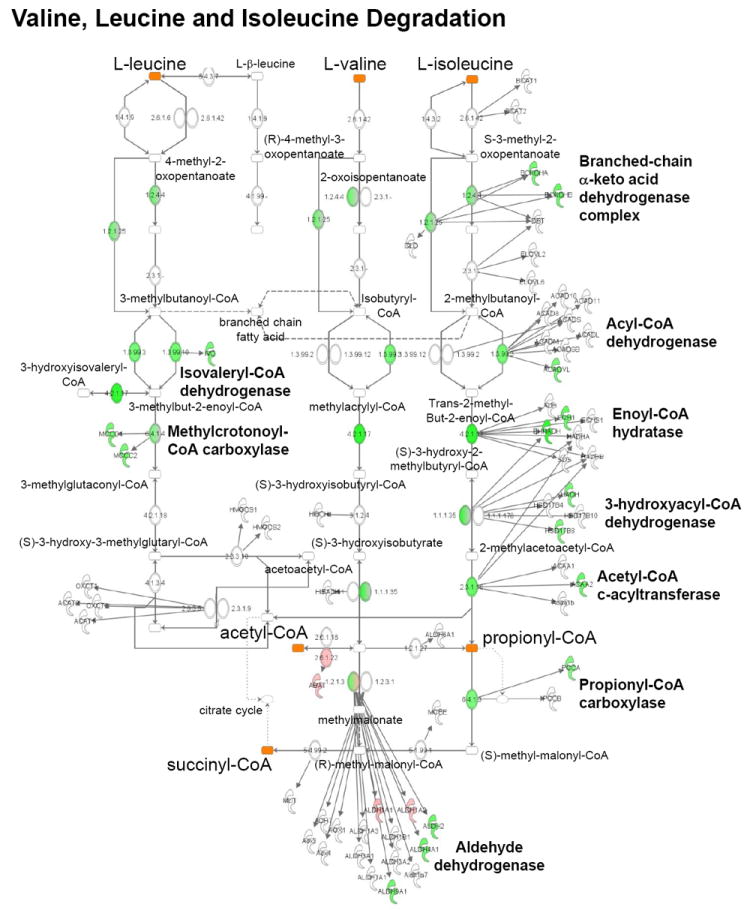
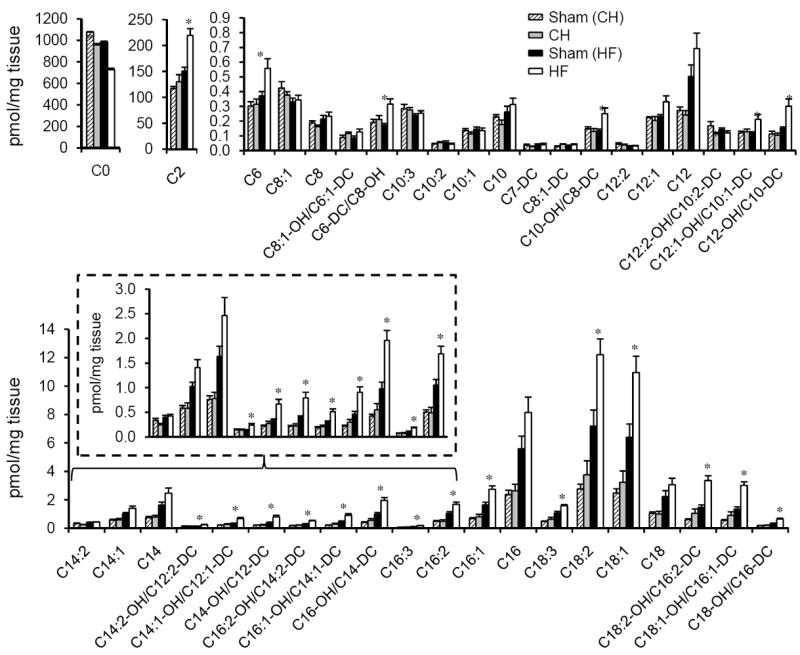
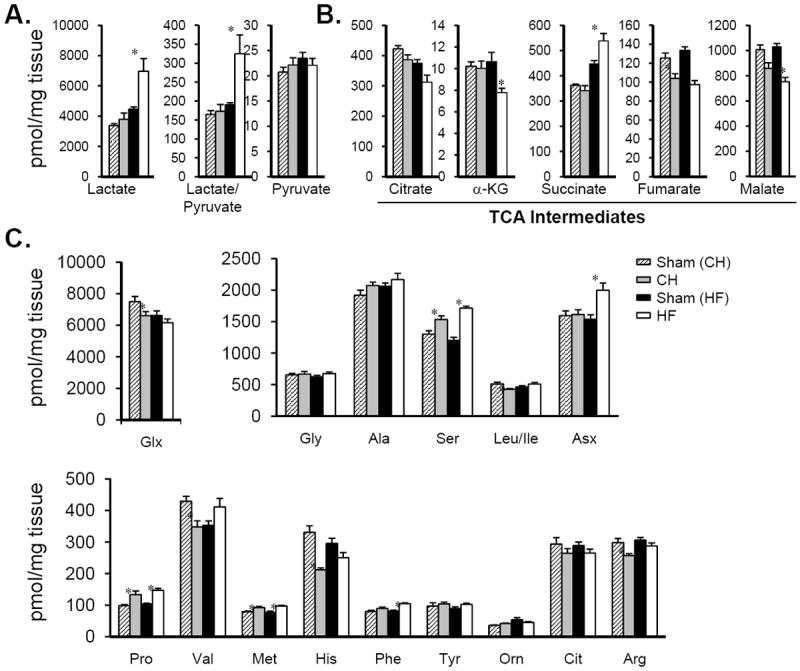
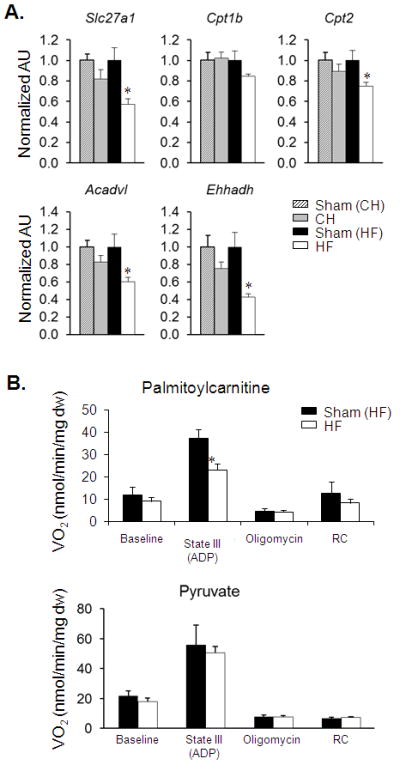
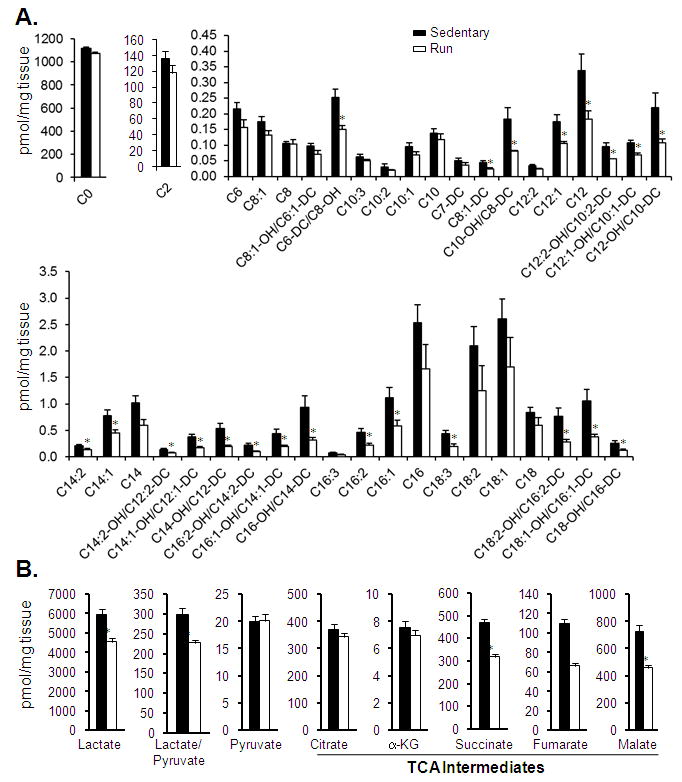
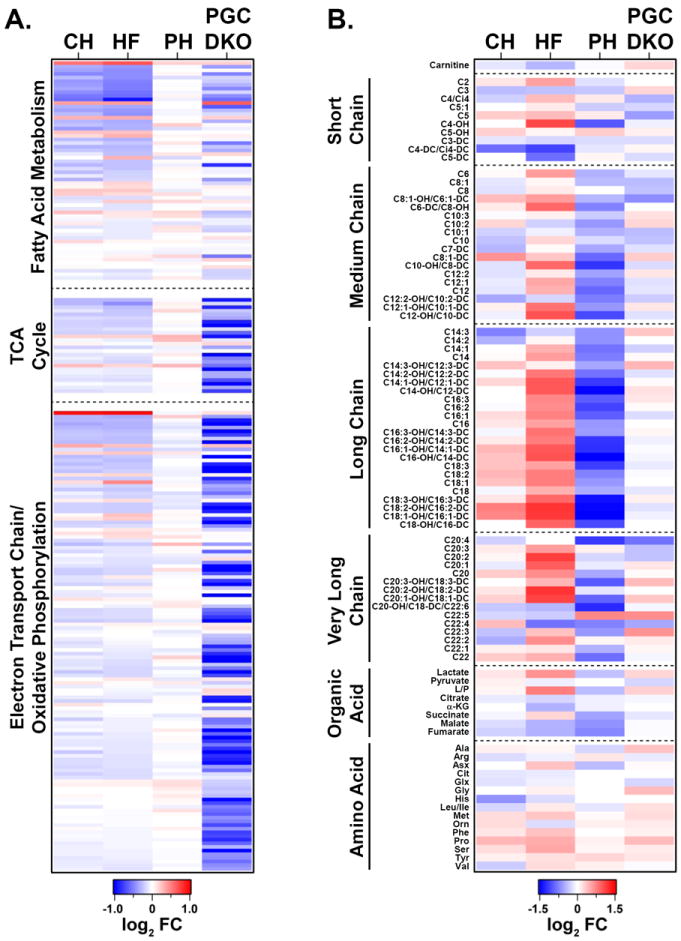
Methods and results: Combined myocardial transcriptomic and metabolomic profiling were conducted in a well-defined mouse model of HF that allows comparative assessment of compensated and decompensated (HF) forms of cardiac hypertrophy because of pressure overload. The pressure overload data sets were also compared with the myocardial transcriptome and metabolome for an adaptive (physiological) form of cardiac hypertrophy because of endurance exercise training. Comparative analysis of the data sets led to the following conclusions: (1) expression of most genes involved in mitochondrial energy transduction were not significantly changed in the hypertrophied or failing heart, with the notable exception of a progressive downregulation of transcripts encoding proteins and enzymes involved in myocyte fatty acid transport and oxidation during the development of HF; (2) tissue metabolite profiles were more broadly regulated than corresponding metabolic gene regulatory changes, suggesting significant regulation at the post-transcriptional level; (3) metabolomic signatures distinguished pathological and physiological forms of cardiac hypertrophy and served as robust markers for the onset of HF; and (4) the pattern of metabolite derangements in the failing heart suggests bottlenecks of carbon substrate flux into the Krebs cycle.
Conclusions: Mitochondrial energy metabolic derangements that occur during the early development of pressure overload-induced HF involve both transcriptional and post-transcriptional events. A subset of the myocardial metabolomic profile robustly distinguished pathological and physiological cardiac remodeling.
Keywords: energy metabolism; heart failure; metabolomics; mitochondria; transcriptome profiling.
© 2014 American Heart Association, Inc.
Figures
Comment in
-
Insights into metabolic remodeling of the hypertrophic and failing myocardium.Circ Heart Fail. 2014 Nov;7(6):874-6. doi: 10.1161/CIRCHEARTFAILURE.114.001803. Circ Heart Fail. 2014. PMID: 25415956 Free PMC article. No abstract available.
Similar articles
-
Integrated Omic Analysis of a Guinea Pig Model of Heart Failure and Sudden Cardiac Death.J Proteome Res. 2016 Sep 2;15(9):3009-28. doi: 10.1021/acs.jproteome.6b00149. Epub 2016 Aug 3. J Proteome Res. 2016. PMID: 27399916 Free PMC article.
-
The energy substrate switch during development of heart failure: gene regulatory mechanisms (Review).Int J Mol Med. 1998 Jan;1(1):17-24. doi: 10.3892/ijmm.1.1.17. Int J Mol Med. 1998. PMID: 9852194 Review.
-
Heart specific PGC-1α deletion identifies metabolome of cardiac restricted metabolic heart failure.Cardiovasc Res. 2019 Jan 1;115(1):107-118. doi: 10.1093/cvr/cvy155. Cardiovasc Res. 2019. PMID: 29931052
-
Exercise-Induced Changes in Glucose Metabolism Promote Physiological Cardiac Growth.Circulation. 2017 Nov 28;136(22):2144-2157. doi: 10.1161/CIRCULATIONAHA.117.028274. Epub 2017 Aug 31. Circulation. 2017. PMID: 28860122 Free PMC article.
-
Metabolic remodeling in hypertrophied and failing myocardium: a review.Am J Physiol Heart Circ Physiol. 2017 Sep 1;313(3):H597-H616. doi: 10.1152/ajpheart.00731.2016. Epub 2017 Jun 23. Am J Physiol Heart Circ Physiol. 2017. PMID: 28646030 Review.
Cited by
-
A 1H-NMR approach to myocardial energetics.Sci Rep. 2020 Oct 14;10(1):17195. doi: 10.1038/s41598-020-74241-3. Sci Rep. 2020. PMID: 33057067 Free PMC article.
-
Mitochondrial Bioenergetics and Dynamism in the Failing Heart.Life (Basel). 2021 May 12;11(5):436. doi: 10.3390/life11050436. Life (Basel). 2021. PMID: 34066065 Free PMC article. Review.
-
Comprehensive metabolic modeling of multiple 13C-isotopomer data sets to study metabolism in perfused working hearts.Am J Physiol Heart Circ Physiol. 2016 Oct 1;311(4):H881-H891. doi: 10.1152/ajpheart.00428.2016. Epub 2016 Aug 5. Am J Physiol Heart Circ Physiol. 2016. PMID: 27496880 Free PMC article.
-
PERM1 regulates energy metabolism in the heart via ERRα/PGC-1α axis.Front Cardiovasc Med. 2022 Nov 7;9:1033457. doi: 10.3389/fcvm.2022.1033457. eCollection 2022. Front Cardiovasc Med. 2022. PMID: 36419485 Free PMC article.
-
Metabolic Reprogramming, Gut Dysbiosis, and Nutrition Intervention in Canine Heart Disease.Front Vet Sci. 2022 Feb 15;9:791754. doi: 10.3389/fvets.2022.791754. eCollection 2022. Front Vet Sci. 2022. PMID: 35242837 Free PMC article. Review.
References
-
- Bing RJ. The metabolism of the heart. Harvey Lect. 1954;50:27–70. - PubMed
-
- Bishop SP, Altschuld RA. Increased glycolytic metabolism in cardiac hypertrophy and congestive failure. Am J Physiol. 1970;218:153–159. - PubMed
-
- Allard MF, Schonekess BO, Henning SL, English DR, Lopaschuk GD. Contribution of oxidative metabolism and glycolysis to ATP production in hypertrophied hearts. Am J Physiol. 1994;267:H742–750. - PubMed
-
- Christe ME, Rodgers RL. Altered glucose and fatty acid oxidation in hearts of the spontaneously hypertensive rat. J Mol Cell Cardiol. 1994;26:1371–1375. - PubMed
-
- Taegtmeyer H, Golfman L, Sharma S, Razeghi P, van Arsdall M. Linking gene expression to function: metabolic flexibility in the normal and diseased heart. Ann N Y Acad Sci. 2004;1015:202–213. - PubMed
Publication types
MeSH terms
Substances
Grants and funding
LinkOut - more resources
Full Text Sources
Other Literature Sources
Medical
Molecular Biology Databases
Research Materials
Miscellaneous
