

Environmental heterogeneity drives within-host diversification and evolution of Pseudomonas aeruginosa
- PMID: 25227464
- PMCID: PMC4172072
- DOI: 10.1128/mBio.01592-14
Environmental heterogeneity drives within-host diversification and evolution of Pseudomonas aeruginosa
Abstract
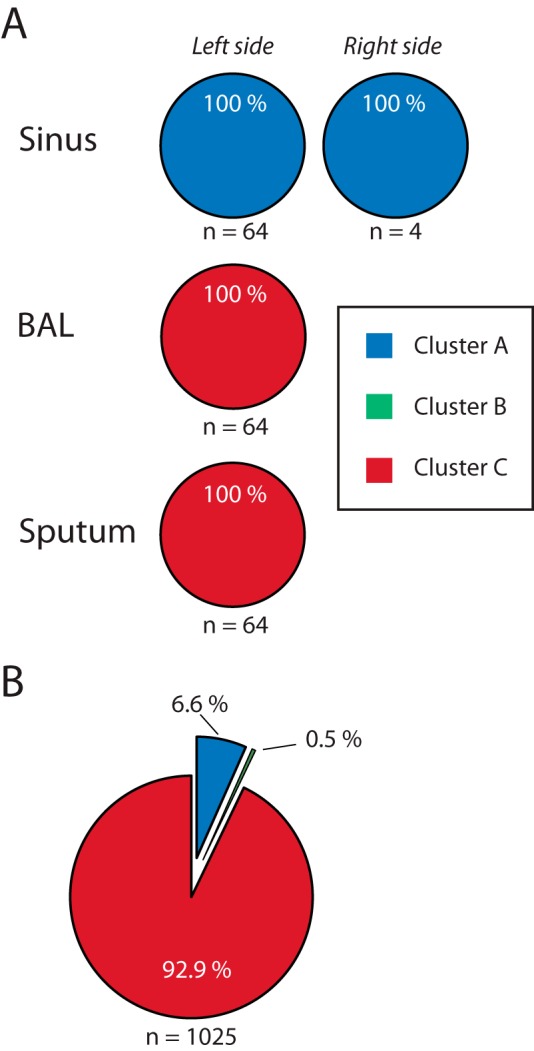
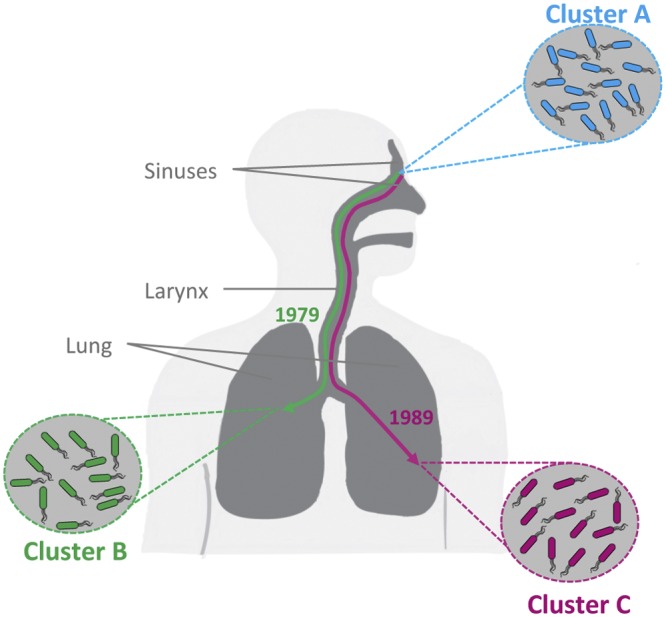
Microbial population polymorphisms are commonly observed in natural environments, including long-term infected hosts. However, the underlying processes promoting and stabilizing diversity are difficult to unravel and are not well understood. Here, we use chronic infection of cystic fibrosis airways by the opportunistic pathogen Pseudomonas aeruginosa as a system for investigating bacterial diversification processes during the course of infection. We analyze clonal bacterial isolates sampled during a 32-year period and map temporal and spatial variations in population diversity to different infection sites within the infected host. We show that the ancestral infecting strain diverged into distinct sublineages, each with their own functional and genomic signatures and rates of adaptation, immediately after initial colonization. The sublineages coexisted in the host for decades, suggesting rapid evolution of stable population polymorphisms. Critically, the observed generation and maintenance of population diversity was the result of partitioning of the sublineages into physically separated niches in the CF airway. The results reveal a complex within-host population structure not previously realized and provide evidence that the heterogeneity of the highly structured and complex host environment promotes the evolution and long-term stability of pathogen population diversity during infection.
Importance: Within-host pathogen evolution and diversification during the course of chronic infections is of importance in relation to therapeutic intervention strategies, yet our understanding of these processes is limited. Here, we investigate intraclonal population diversity in P. aeruginosa during chronic airway infections in cystic fibrosis patients. We show the evolution of a diverse population structure immediately after initial colonization, with divergence into multiple distinct sublineages that coexisted for decades and occupied distinct niches. Our results suggest that the spatial heterogeneity in CF airways plays a major role in relation to the generation and maintenance of population diversity and emphasize that a single isolate in sputum may not represent the entire pathogen population in the infected individual. A more complete understanding of the evolution of distinct clonal variants and their distribution in different niches could have positive implications for efficient therapy.
Copyright © 2014 Markussen et al.
Figures
Similar articles
-
Transmission and lineage displacement drive rapid population genomic flux in cystic fibrosis airway infections of a Pseudomonas aeruginosa epidemic strain.Microb Genom. 2018 Mar;4(3):e000167. doi: 10.1099/mgen.0.000167. Epub 2018 Mar 16. Microb Genom. 2018. PMID: 29547097 Free PMC article.
-
Coexistence and within-host evolution of diversified lineages of hypermutable Pseudomonas aeruginosa in long-term cystic fibrosis infections.PLoS Genet. 2014 Oct 16;10(10):e1004651. doi: 10.1371/journal.pgen.1004651. eCollection 2014 Oct. PLoS Genet. 2014. PMID: 25330091 Free PMC article.
-
Selective Sweeps and Parallel Pathoadaptation Drive Pseudomonas aeruginosa Evolution in the Cystic Fibrosis Lung.mBio. 2015 Sep 1;6(5):e00981-15. doi: 10.1128/mBio.00981-15. mBio. 2015. PMID: 26330513 Free PMC article.
-
Evolutionary insight from whole-genome sequencing of Pseudomonas aeruginosa from cystic fibrosis patients.Future Microbiol. 2015;10(4):599-611. doi: 10.2217/fmb.15.3. Future Microbiol. 2015. PMID: 25865196 Review.
-
Microevolution of Pseudomonas aeruginosa to a chronic pathogen of the cystic fibrosis lung.Curr Top Microbiol Immunol. 2013;358:91-118. doi: 10.1007/82_2011_199. Curr Top Microbiol Immunol. 2013. PMID: 22311171 Review.
Cited by
-
Divergent, coexisting Pseudomonas aeruginosa lineages in chronic cystic fibrosis lung infections.Am J Respir Crit Care Med. 2015 Apr 1;191(7):775-85. doi: 10.1164/rccm.201409-1646OC. Am J Respir Crit Care Med. 2015. PMID: 25590983 Free PMC article.
-
P. aeruginosa interactions with other microbes in biofilms during co-infection.AIMS Microbiol. 2023 Aug 10;9(4):612-646. doi: 10.3934/microbiol.2023032. eCollection 2023. AIMS Microbiol. 2023. PMID: 38173971 Free PMC article. Review.
-
Metabolic modeling of a chronic wound biofilm consortium predicts spatial partitioning of bacterial species.BMC Syst Biol. 2016 Sep 7;10(1):90. doi: 10.1186/s12918-016-0334-8. BMC Syst Biol. 2016. PMID: 27604263 Free PMC article.
-
Privatisation rescues function following loss of cooperation.Elife. 2018 Dec 18;7:e38594. doi: 10.7554/eLife.38594. Elife. 2018. PMID: 30558711 Free PMC article.
-
Cooperativity between Stenotrophomonas maltophilia and Pseudomonas aeruginosa during Polymicrobial Airway Infections.Infect Immun. 2020 Mar 23;88(4):e00855-19. doi: 10.1128/IAI.00855-19. Print 2020 Mar 23. Infect Immun. 2020. PMID: 31932329 Free PMC article.
References
-
- Smith EE, Buckley DG, Wu Z, Saenphimmachak C, Hoffman LR, D’Argenio DA, Miller SI, Ramsey BW, Speert DP, Moskowitz SM, Burns JL, Kaul R, Olson MV. 2006. Genetic adaptation by Pseudomonas aeruginosa to the airways of cystic fibrosis patients. Proc. Natl. Acad. Sci. U. S. A. 103:8487–8492. 10.1073/pnas.0602138103 - DOI - PMC - PubMed
Publication types
MeSH terms
LinkOut - more resources
Full Text Sources
Other Literature Sources
