. 2014 Oct;20(10):1138-46.
doi: 10.1038/nm.3679. Epub 2014 Sep 14.

In vivo RNAi screening identifies a mechanism of sorafenib resistance in liver cancer

Affiliations

In vivo RNAi screening identifies a mechanism of sorafenib resistance in liver cancer

Ramona Rudalska et al. Nat Med. 2014 Oct.

Abstract

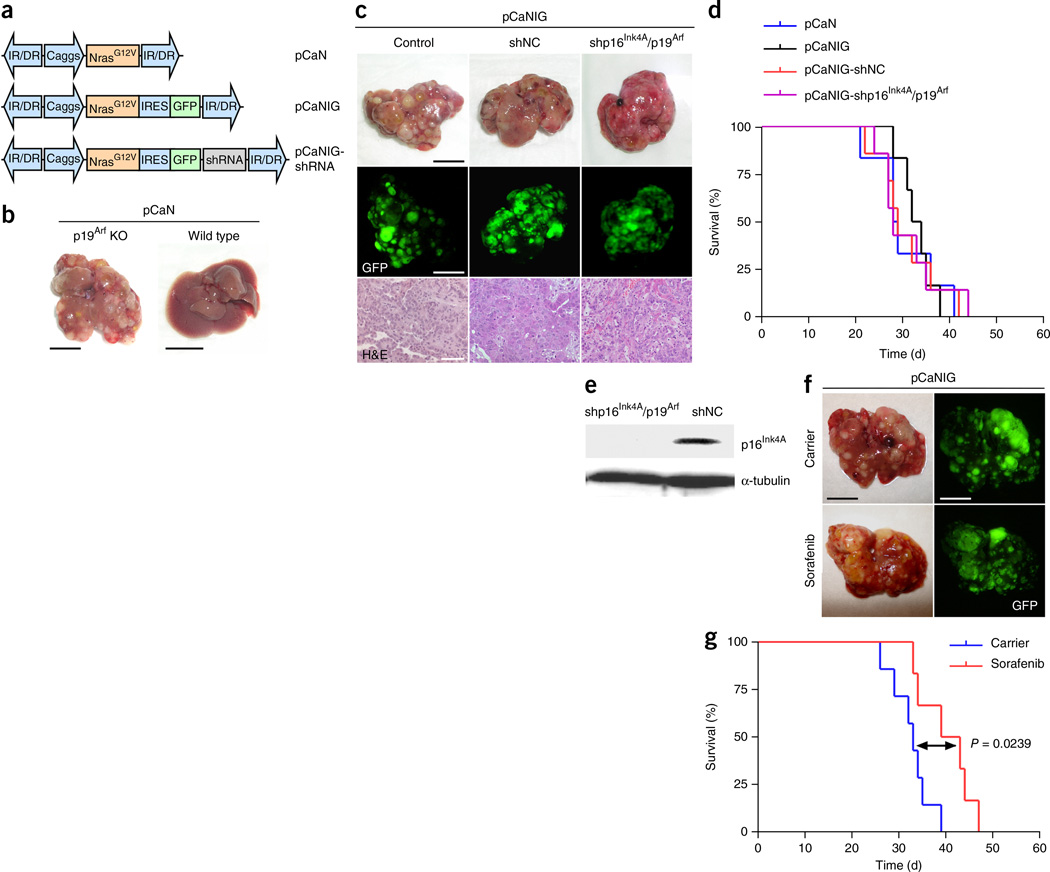
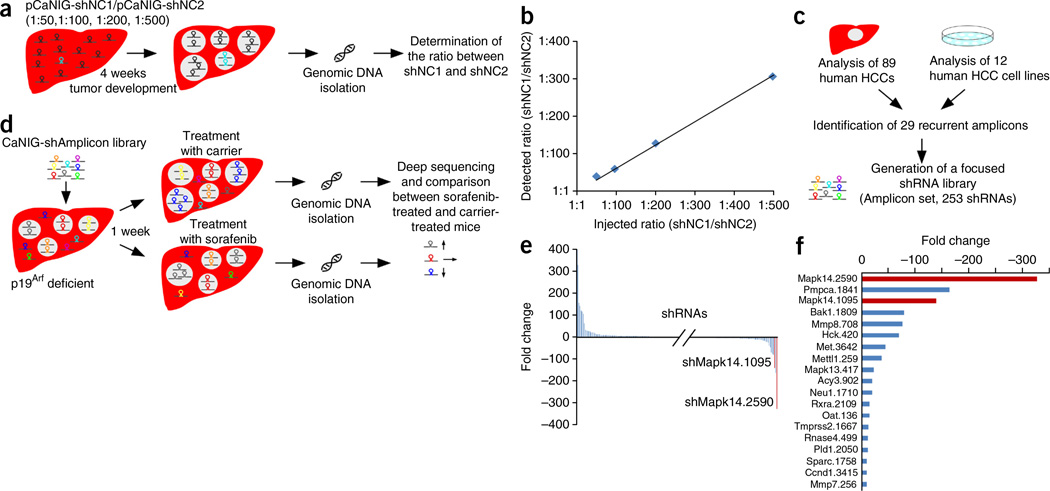
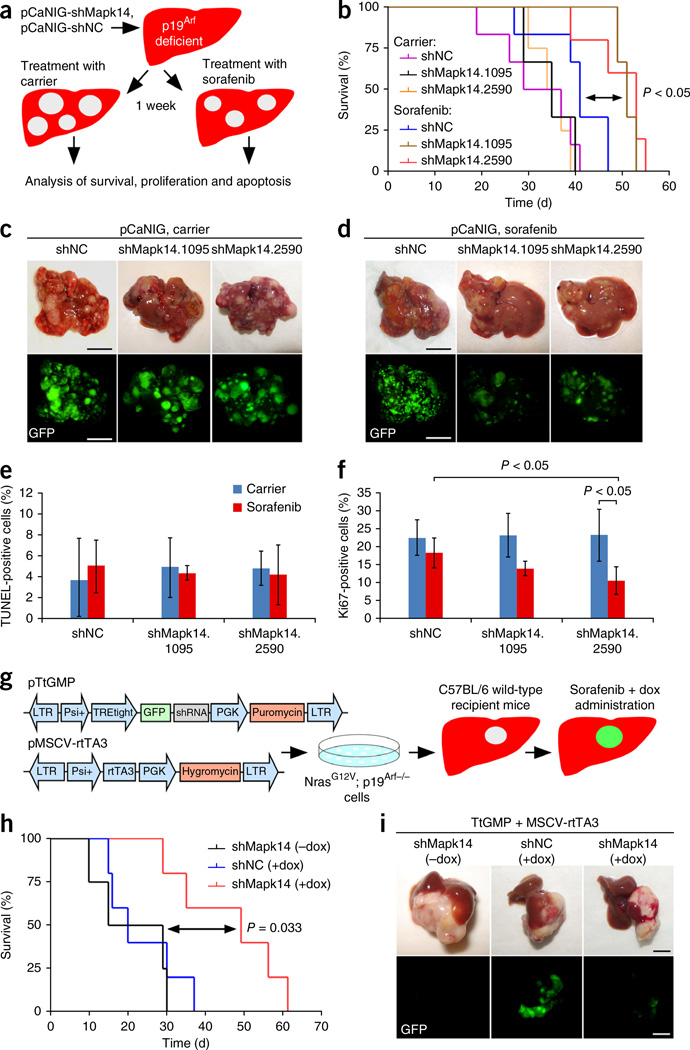
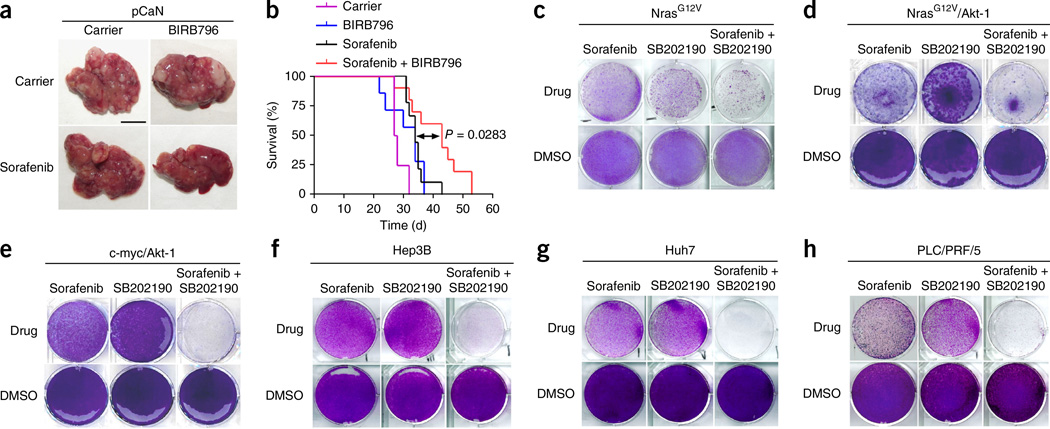
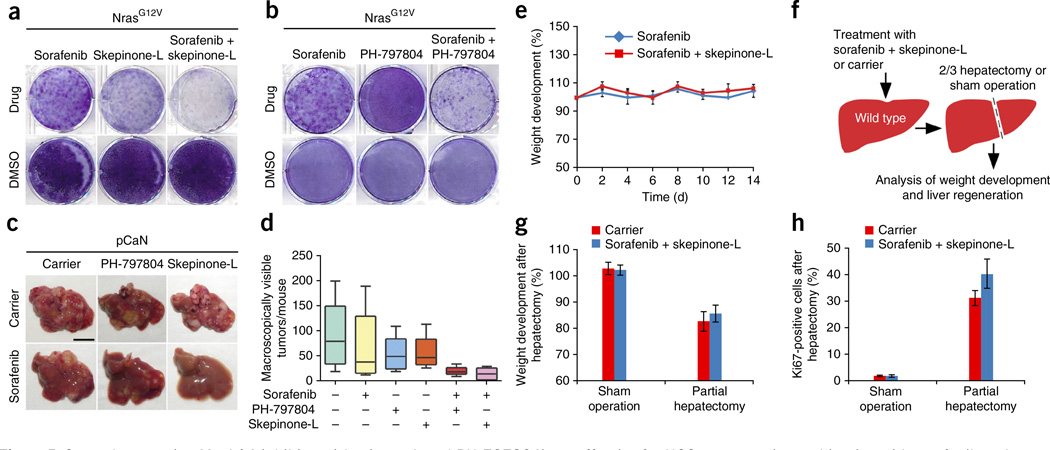
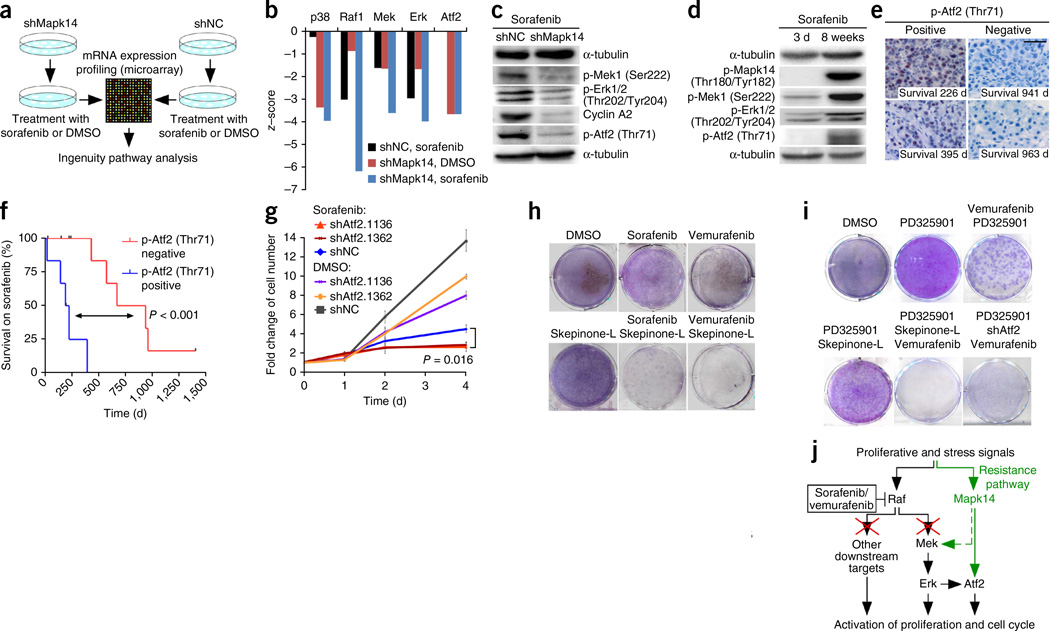
In solid tumors, resistance to therapy inevitably develops upon treatment with cytotoxic drugs or molecularly targeted therapies. Here, we describe a system that enables pooled shRNA screening directly in mouse hepatocellular carcinomas (HCC) in vivo to identify genes likely to be involved in therapy resistance. Using a focused shRNA library targeting genes located within focal genomic amplifications of human HCC, we screened for genes whose inhibition increased the therapeutic efficacy of the multikinase inhibitor sorafenib. Both shRNA-mediated and pharmacological silencing of Mapk14 (p38α) were found to sensitize mouse HCC to sorafenib therapy and prolong survival by abrogating Mapk14-dependent activation of Mek-Erk and Atf2 signaling. Elevated Mapk14-Atf2 signaling predicted poor response to sorafenib therapy in human HCC, and sorafenib resistance of p-Mapk14-expressing HCC cells could be reverted by silencing Mapk14. Our results suggest that a combination of sorafenib and Mapk14 blockade is a promising approach to overcoming therapy resistance of human HCC.


Figures

Figure 1
Figure 1
A transposon-based mouse model of liver cancer shows therapy resistance resembling that of human HCC. (a) Schematic representation of transposable elements encoding oncogenic NrasG12V, GFP and miR30- based shRNAs. Caggs, CAGGS promoter; IR/DR, inverted repeats and direct repeats; IRES, internal ribosome entry site. (b) Representative photographs of intrahepatic tumor burden 5 weeks after delivery of NrasG12V (pCaN) into p19Arf-deficient or wild-type mice (n = 6 for each condition; scale bars, 1 cm). (c) Representative photographs (top), GFP imaging (middle) and H&E staining (bottom) 5 weeks after delivery of pCaNIG (Control), pCaNIG-shNC (containing a noncoding shRNA) and pCaNIG-shp16Ink4A/p19Arf into p19Arf-deficient mice (n = 6 for each condition; scale bars: 1 cm (top and middle), 50 µm (bottom)). (d) Survival analyses (Kaplan-Meier format) of the same p19Arf-deficient mice after delivery of pCaN (n = 6), pCaNIG (n = 6), pCaNIG-shNC (n = 7) and pCaNIG-shp16Ink4A/p19Arf (n = 7) transposons (no statistical significant difference between the different groups could be found by log-rank test). (e) In vivo knockdown test of transposon-encoded shRNAs by p16Ink4A western blot analysis from tumors triggered by pCaNIG-shp16Ink4A/p19Arf or pCaNIG-shNC delivery into p19Arf-deficient mice (n = 3 for each condition). (f) Intrahepatic tumor burden of p19Arf-deficient mice 5 weeks after injection of pCaNIG and treatment with sorafenib (100 mg/kg, n = 5) or carrier (n = 6) (representative photographs and GFP images; scale bars, 1 cm). (g) Survival analyses (Kaplan-Meier format) of p19Arf-deficient mice after injection of pCaNIG and treatment with sorafenib (n = 6) or carrier (n = 7) (treatment was started 1 week after injection; statistical significance was calculated using a log-rank test).
Figure 2
Figure 2
Outline and results of an in vivo RNAi screen to identify sorafenib treatment response modifiers. (a) Schematic outline of a dilution experiment to determine the maximum number of shRNAs that can be recovered from HCC-bearing mouse livers. (b) Results of the dilution experiment outlined in a. Plotted is the detected ratio of shNC1 to shNC2 in p19Arf-deficient livers 4 weeks after delivery of pCaNIG-shNC1 and pCaNIG-shNC2 (y axis), in relation to the ratio injected (x axis) (values represent mean; n = 2). (c) Schematic outline of the workflow for compilation of a focused shRNA library (Amplicon set). (d) Scheme of the in vivo RNAi screen. (e) Enrichment or depletion of individual shRNAs that were screened as described in d. The representation of each shRNA after sorafenib treatment (n = 9) was compared to its representation after treatment with carrier alone (n = 9). (f) Overview of shRNAs that showed at least 10-fold depletion in sorafenib-treated mice compared to carrier-treated mice. Plotted are the fold changes of shRNA abundance in the sorafenib-treated group compared to carrier-treated group. Top-scoring shRNAs targeting Mapk14 are marked in red.
Figure 3
Figure 3
Functional genetic validation of Mapk14 as a sorafenib sensitizer gene. (a) Schematic outline of functional genetic testing of Mapk14 shRNAs in NrasG12V; p19Arf-deficient mouse HCCs. (b) Survival analyses (Kaplan-Meier format) of p19Arf-deficient mice injected with pCaNIG-shMapk14 or pCaNIG-shNC transposons treated with sorafenib or carrier starting 1 week after injection (carrier: shNC, n = 6; shMapk14.1095, n = 3; shMapk14.2590, n = 4; sorafenib: shNC, n = 6; shMapk14.1095, n = 3; shMapk14.2590, n = 5; statistical significance was calculated using a log-rank test). (c,d) Intrahepatic tumor burden of p19Arf-deficient mice 5 weeks after injection of pCaNIG-shMapk14 or pCaNIG-shNC transposons and administration of carrier or sorafenib (carrier: shNC, n = 6; shMapk14.1095, n = 5; shMapk14.2590, n = 5; sorafenib: shNC, n = 6; shMapk14.1095, n = 5; shMapk14.2590, n = 5; representative photographs and GFP images; scale bars, 1 cm). (e,f) Quantification of TUNEL- (e) and Ki67-positive (f) cells in p19Arf-deficient tumor nodules 5 weeks after injection of pCaNIG-shMapk14 or pCaNIG-shNC transposons and administration of carrier or sorafenib (carrier: shNC, n = 3; shMapk14.1095, n = 3; shMapk14.2590, n = 3; sorafenib: shNC, n = 4; shMapk14.1095, n = 3; shMapk14.2590, n = 3; represent mean ± s.d.; statistical significance calculated using two-tailed Student’s t-test). (g) Schematic outline for the generation of NrasG12V-driven liver tumors with inducible shRNA expression. (h) Survival analyses (Kaplan-Meier format) of wild-type mice after in situ transplantation of NrasG12V; p19Arf-deficient liver tumor cells stably expressing MSCV-rtTA3 and TtGMP-shMapk14 or TtGMP-shNC, with doxycycline (dox) and sorafenib administered starting 1 week after injection (shMapk14 - doxycycline, n = 4; shNC + doxycycline, n = 5; shMapk14 + doxycycline, n = 5; statistical significance was calculated using a log-rank test). (i) Representative pictures of tumor burden 6 weeks after in situ transplantation of NrasG12V; p19Arf-deficient cells expressing TtGMP-shMapk14 or TtGMP-shNC and treatment as described in i (scale bars, 1 cm; n = 5 for each condition).
Figure 4
Figure 4
Pharmacological inhibition of Mapk14 sensitizes to sorafenib therapy. (a) Intrahepatic tumor burden of p19Arf-deficient mice 4 weeks after stable delivery of NrasG12V (pCaN) and treatment with sorafenib, BIRB796, sorafenib and BIRB796 combination and corresponding carriers (representative photographs; scale bar, 1 cm; n = 5 for each condition). (b) Survival analyses (Kaplan-Meier format) of p19Arf-deficient mice after injection of NrasG12V and indicated treatment, as described in a (carrier, n = 4; BIRB796, n = 7; sorafenib, n = 9; sorafenib + BIRB796, n = 10; statistical significance was calculated using a log-rank test). (c) Crystal violet staining of NrasG12V; p19Arf-deficient cells after 4 d of treatment with sorafenib, SB202190, a combination thereof or corresponding DMSO concentrations (representative photographs, n = 3 for each condition). (d,e) Colony formation (crystal violet staining) of p19Arf-deficient NrasG12V/Akt-1 and c-myc/Akt-1 cells after 4 d of treatment with sorafenib, SB202190, a combination thereof or corresponding DMSO concentrations (representative photographs, n = 3 for each condition). (f–h) Colony formation of Hep3B, Huh7 and PLC/PRF/5 cells after 4 d of the indicated treatment. Cells were treated with sorafenib, SB202190, a combination thereof or corresponding DMSO concentrations (representative photographs, n = 3 for each condition).
Figure 5
Figure 5
Second-generation Mapk14 inhibitors (skepinone-L and PH-797804) are effective for HCC treatment in combination with sorafenib and exert no adverse effects. (a) Colony formation (crystal violet staining) of NrasG12V; p19Arf-deficient HCC cells after a 4-d treatment with sorafenib, skepinone-L, a combination thereof or corresponding DMSO concentrations (representative photographs, n = 3 for each condition). (b) Crystal violet staining of NrasG12V; p19Arf-deficient cells after a 4-d treatment with sorafenib, PH-797804, a combination thereof or corresponding DMSO concentrations (representative pictures, n = 3 for each condition). (c) Intrahepatic tumor burden of p19Arf-deficient mice 4 weeks after NrasG12V injection (pCaN) and treatment with sorafenib, skepinone-L or PH-797804, combinations thereof and carrier (scale bar, 1 cm; n = 5 (carrier, PH-797804, skepinone-L, sorafenib + PH-797804, sorafenib + skepinone-L) or n = 6 (sorafenib)). (d) Quantification of macroscopically visible tumors 4 weeks after NrasG12V injection and treatments as described in c. (e) Weight changes in sorafenib-treated and sorafenib- and skepinone-L-treated p19Arf-deficient mice after NrasG12V delivery (mean ± s.d., n = 3 for each condition). (f) Testing of liver regeneration in sorafenib- and skepinone-L-treated mice after partial (two-third) hepatectomy. (g) Body weight development of mice treated with sorafenib and skepinone-L or carrier 42 h after two-third hepatectomy or sham surgery (mean ± s.d., n = 3 (carrier: sham operation, carrier: partial hepatectomy, treated: sham operation) or n = 4 (treated: partial hepatectomy)). (h) Percentage of Ki67-positive cells in livers, 42 h after two-third hepatectomy or sham surgery in sorafenib and skepinone-L or carrier mice (mean ± s.d., n = 3 (carrier: sham operation, carrier: partial hepatectomy, treated: sham operation) or n = 4 (treated: partial hepatectomy)).
Figure 6
Figure 6
Cross-talk of Mapk14 and Mek-Erk signaling in HCC and its role in sorafenib resistance. (a) Outline of gene expression and Ingenuity pathway analysis of mouse hepatoma cells. (b) Ingenuity analysis of mRNA expression data of NrasG12V; p19Arf-deficient hepatoma cells expressing shNC or shMapk14 after treatment with sorafenib or DMSO. Data were normalized against those for DMSO-treated NrasG12V-shNC cells. (c) Sorafenib-treated cells as described in b were analyzed by western blotting using the indicated antibodies (n = 3 for each condition; representative images from at least two blots). (d) Western blot of NrasG12V; p19Arf-deficient mouse HCC cells upon 3 d or 8 weeks of sorafenib treatment (n = 3 for each condition; representative images from at least two blots) using the indicated antibodies. (e) p-Atf2 immunostaining of human HCC sections from biopsies taken before sorafenib therapy. Numbers indicate survival time under treatment. Images are representative of 16 patients. (f) Kaplan-Meier survival analyses of sorafenib-treated HCC patients with high (positive, n = 6) versus low (negative, n = 10) p-Atf2 expression in biopsies taken before sorafenib therapy (log-rank test). (g) Cell doubling rates of NrasG12V-shNC and NrasG12V-shAtf2 cells treated with sorafenib or DMSO for 4 d (mean ± s.d., n = 4; two-tailed Student’s t-test). (h) Colony formation (crystal violet staining) of NrasG12V; p19Arf-deficient HCC cells after 4 d of the indicated treatment (representative pictures, n = 3 for each condition). (i) Colony formation of NrasG12V; p19Arf-deficient HCC cells after 4 d of treatment with the indicated inhibitors (representative pictures, n = 3 for each condition). (j) Scheme indicating the roles of Mapk14 and Raf-Mek-Erk signaling in sorafenib sensitivity and resistance.

Comment in

Similar articles

Cited by

References

    1. Poulikakos PI, Rosen N. Mutant BRAF melanomas—dependence and resistance. Cancer Cell. 2011;19:11–15. - PubMed
    1. Hartsough E, Shao Y, Aplin AE. Resistance to RAF inhibitors revisited. J. Invest. Dermatol. 2014;134:319–325. - PMC - PubMed
    1. Berasain C. Hepatocellular carcinoma and sorafenib: too many resistance mechanisms? Gut. 2013;62:1674–1675. - PubMed
    1. Bruix J, Gores GJ, Mazzaferro V. Hepatocellular carcinoma: clinical frontiers and perspectives. Gut. 2014;63:844–855. - PMC - PubMed
    1. Yau T, Chan P, Epstein R, Poon RT. Evolution of systemic therapy of advanced hepatocellular carcinoma. World J. Gastroenterol. 2008;14:6437–6441. - PMC - PubMed

Publication types

MeSH terms