. 2014 Sep 25;8(6):1767-1780.
doi: 10.1016/j.celrep.2014.08.006. Epub 2014 Sep 4.

AMPK modulates tissue and organismal aging in a non-cell-autonomous manner

Affiliations

AMPK modulates tissue and organismal aging in a non-cell-autonomous manner

Matthew Ulgherait et al. Cell Rep. .

Abstract

AMPK exerts prolongevity effects in diverse species; however, the tissue-specific mechanisms involved are poorly understood. Here, we show that upregulation of AMPK in the adult Drosophila nervous system induces autophagy both in the brain and also in the intestinal epithelium. Induction of autophagy is linked to improved intestinal homeostasis during aging and extended lifespan. Neuronal upregulation of the autophagy-specific protein kinase Atg1 is both necessary and sufficient to induce these intertissue effects during aging and to prolong the lifespan. Furthermore, upregulation of AMPK in the adult intestine induces autophagy both cell autonomously and non-cell-autonomously in the brain, slows systemic aging, and prolongs the lifespan. We show that the organism-wide response to tissue-specific AMPK/Atg1 activation is linked to reduced insulin-like peptide levels in the brain and a systemic increase in 4E-BP expression. Together, these results reveal that localized activation of AMPK and/or Atg1 in key tissues can slow aging in a non-cell-autonomous manner.


Figures

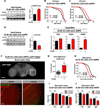
Figure 1
Figure 1. Neuronal AMPK activation extends lifespan
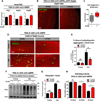
(A) Western blot analysis of AMPK phosphorylated on T184 (p-AMPK) and loading control (actin) from head lysates of 10 day old ELAV-GS>UAS-AMPK female flies with or without RU486-mediated transgene induction. Densitometry quantification (right) (p<0.0001; t-test; n=3 replicates; 10 heads/replicate). (B) Survival curves of ELAV-GS>UAS-AMPK females with or without RU486-mediated transgene induction (p<0.0001; log-rank test; n> 106 flies). (C) Survival curves of ELAV-GS>UAS-mCh-AMPK females with or without RU486-mediated transgene induction (p<0.0001 log-rank test; n> 159 flies). (D) Western blot analysis of S6K phosphorylated at T398 and total S6K from head lysates of 10 day old ELAV-GS>UAS-mCh-AMPK female flies with or without RU486-mediated transgene induction. Densitometry quantification (right) (p<0.0098; t-test; n=3 replicates; 10 heads/replicate). (E) Expression of autophagy genes in head tissue of 10 day old ELAV-GS>UAS-mCh-AMPK female flies with or without RU486-mediated transgene induction. (t-test; n=3 of RNA extracted from 10 heads/replicate). (F) GFP-Atg8a localization in adult brain with 10X objective (above) and representative images (below) from optic lobes of 10 day old ELAV-GS>UAS-mCh-AMPK, pGFP-Atg8a female flies with or without RU486-mediated transgene induction (red channel-phalloidin, green channel-GFP-Atg8a, upper scale bar represents 50µm, lower scale bar represents 10µm). (G) Quantification of brain GFP-Atg8a foci (p<0.004; t-test; n>10 confocal stacks from optic lobes/condition; one brain/replicate stack). (H) Survival curves without food of ELAV-GS>UAS-mCh-AMPK female flies with or without RU486-mediated transgene induction (p<0.0001; log-rank; n>122 flies/condition). (I) Body mass during starvation of ELAV-GS>UAS-mCh-AMPK female flies with or without RU486-mediated transgene induction (p<0.05, at 48hours and 96 hours of starvation; t-test; n>6 samples/condition; 10 flies weighed/sample). (J) Whole body lipid stores during starvation of ELAV-GS>UAS-mCh-AMPK female flies with or without RU486-mediated transgene induction. (p<0.01 at 48 hours, and p<0.05 at 96 hours of starvation; t-test; n>3 samples/condition/timepoint; lipids extracted from 5 flies per sample). Data are represented as mean ± SEM. RU486 was provided in the media after eclosion at a concentration of 50 µg/ml (A, B) and 25µg/ml (C–J)
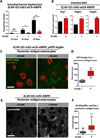
Figure 2
Figure 2. Neuronal AMPK activation maintains intestinal homeostasis during aging
(A) Intestinal integrity during aging in ELAV-GS>UAS-mCh-AMPK female flies with or without RU486-mediated transgene induction (p<0.05; binomial test, at 30 days of age, and p<0.01 at 45 days; n> 60 flies/condition). (B) Intestinal expression of autophagy genes in 10 day old ELAV-GS>UAS-mCh-AMPK female flies (p<0.01 for Atg1, p<0.001 for Atg8a and Atg8b; t-test; n=3 of RNA extracted from 15 intestines/replicate). (C) GFP-Atg8a staining. Representative images of enterocytes from the posterior midgut of 10 day old ELAV-GS>UAS-mCh-AMPK, pGFP-Atg8a female flies with or without RU486-mediated transgene induction (red channel-TO-PRO-3 DNA stain, green channel-GFP-Atg8a, scale bar represents 10µm). (D) Quantification of posterior midgut GFP-Atg8a foci (p<0.0001; t-test; n>10 confocal stacks from posterior midgut/condition; one fly per replicate stack). (E) Lysotracker Red staining. Representative images of posterior midgut enterocytes from 10 day old ELAV-GS>UAS-AMPK female flies with or without RU486-mediated transgene induction (scale bars represent 10µm). (F) Quantification of acidophilic vesicles (p<0.0001; t-test; n>19 confocal stacks from posterior midgut/condition; one fly per replicate stack). Data are represented as mean ± SEM. RU486 was provided in the media after eclosion at a concentration of 50µg/ml (E, F) and 25µg/ml in all remaining figures.
Figure 3
Figure 3. Neuronal AMPK activation maintains protein homeostasis during muscle aging
(A) Confocal images of indirect flight muscle, in ELAV-GS>UAS-mCh-AMPK female flies with or without RU486-mediated transgene induction, showing protein polyubiquitinated aggregates at young (10 days), and aged (30 days) timepoints (red channel-phalloidin/F-actin, green channel- anti-polyubiquitin, scale bar represents 10µm). (B) Quantification of polyubiquitin aggregates in muscle (p<0.001; t-test; n>10; one fly/replicate stack). (C) Western blot detection of total ubiquitin-conjugated proteins from thorax detergent-insoluble extracts of young (10 days) and aged (30 days) ELAV-GS>UAS-mCh-AMPK female flies with or without RU486-mediated transgene induction. (D) Densitometry of ubiquitin blots from thoraces of flies (p<0.001; t-test; n=4 samples/condition; 10 thoraces/sample). (E) Climbing activity of ELAV-GS>UAS-mCh-AMPK female flies with or without RU486-mediated transgene induction. (p<0.05; t-test; n>6 vials/condition; 30 flies/vial). Data are represented as mean ± SEM. RU486 was provided in the media after eclosion at a concentration of 25µg/ml.
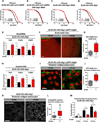
Figure 4
Figure 4. Neuronal Atg1 up-regulation maintains intestinal homeostasis during aging and extends lifespan
(A) Survival curves of ELAV-GS>UAS-mCh-AMPK female flies with or without RU486-mediated transgene induction (p<0.0001; log-rank test; n> 138 flies). (B) Survival curves of ELAV-GS>UAS-mCh-AMPK, UAS-Atg1-RNAi female flies with or without RU486-mediated transgene induction (p>0.0284; log-rank test; n>210 flies). (C) Survival curves of ELAV-GS>UAS-Atg1-RNAi female flies with or without RU486-mediated transgene induction (p>0.05; log-rank test; n>111 flies). (D) Survival curves of ELAV-GS>UAS-Atg1 female flies with or without RU486-mediated transgene induction (p>0.0001; log-rank test; n> 151 flies). (E) Expression levels of autophagy genes in heads of 10 day old ELAV-GS>UAS-Atg1 female flies with or without RU486-mediated transgene induction (t-test; n>3 of RNA extracted from 10 heads/replicate). (F) Brain GFP-Atg8a Staining. Representative images from optic lobes of 10 day old ELAV-GS>UAS-Atg1, pGFP-Atg8a females with or without RU486-mediated transgene expression (red channel-phalloidin, green channel-GFP-Atg8a, scale bar represents 10µm). (G) Quantification of brain GFP-Atg8a foci (p<0.0082; t-test; n>10 confocal stacks from optic lobes/condition; one brain/replicate stack). (H) Expression levels of autophagy genes in the intestines of 10 day old ELAV-GS>UAS-Atg1 female flies with or without RU486-mediated transgene induction (t-test; n>3 of RNA extracted from 15 intestines/replicate). (I) GFP-Atg8a staining. Representative images of enterocytes from the posterior midgut of 10 day old ELAV-GS>UAS-Atg1, pGFP-Atg8a female flies with or without RU486-mediated transgene induction in neurons (red channel-TO-PRO-3 DNA stain, green channel-GFP-Atg8a, scale bar represents 10µm). (J) Quantification of posterior midgut GFP-Atg8a foci (p<0.0001; t-test; n>10 confocal stacks from posterior midgut/condition; one fly per replicate stack). (K) Lysotracker Red staining. Representative images of posterior midgut enterocytes from 10 day old ELAV-GS>UAS-Atg1 female flies with or without RU486-mediated transgene induction stained with the acidophilic dye (scale bar represents 10µm). (L) Quantification of acidophilic vesicles (p<0.0001; t-test; n>25 confocal stacks from posterior midgut/condition; one fly per replicate stack). (M) Intestinal integrity during aging in ELAV-GS>UAS-Atg1 females with or without RU486-mediated transgene induction (p<0.001; binomial test, at 30 and 45 days; n>91 flies/condition). Data are represented as mean ± SEM. RU486 was provided in the media after eclosion at a concentration of 50µg/ml for all figures.
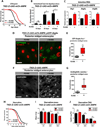
Figure 5
Figure 5. Intestinal AMPK activation maintains intestinal homeostasis during aging and extends lifespan
(A) Survival curves of TIGS-2>UAS-mCh-AMPK females with or without RU486-mediated transgene induction (p<0.0001; log-rank test; n>116 flies). (B) Intestinal integrity during aging in TIGS-2>UAS-mCh-AMPK females with or without RU486-mediated transgene induction (p<0.01, at 30 days, p<0.05 at 45 days; binomial test; n>127 flies/condition). (C) Expression levels of autophagy genes in from intestines of TIGS-2>UAS-mCh-AMPK female flies at 10 days of adulthood with or without RU486-mediated transgene induction. (t-test; n>3 of RNA extracted from 15 intestines/replicate). (D) GFP-Atg8a staining. Representative images of enterocytes from the posterior midgut of 10 day old TIGS-2>UAS-mCh-AMPK, pGFP-Atg8a females with or without RU486-mediated transgene expression (red channel-TO-PRO-3 DNA stain, green channel-GFP-Atg8a, scale bar represents 10µm). (E) Quantification of posterior midgut GFP-Atg8a foci (p<0.0001; t-test; n>10 confocal stacks from posterior midgut/condition; one fly per replicate stack). (F) Lysotracker Red staining. Representative images of posterior midgut enterocytes from 10 day old TIGS-2>UAS-AMPK females with or without RU486-mediated transgene induction (scale bar represents 10µm). (G) Quantification of acidophilic vesicles (p<0.0001; t-test; n>10 confocal stacks from posterior midgut/condition; one fly per replicate stack). (H) Survival curves without food of TIGS-2>UAS-mCh-AMPK females with or without RU486-mediated transgene induction (p<0.001; log-rank; n>257 flies). (I) Body mass during starvation of TIGS-2>UAS-mCh-AMPK females with or without RU486-mediated transgene induction (p<0.05, at 48hours and p<0.01 at 96 hours of starvation; t-test; n>6 samples/condition; 10 flies weighed/sample). (J) Whole body lipid stores during starvation of TIGS-2>UAS-mCh-AMPK females with or without RU486-mediated transgene induction (p<0.01 at 48 hours, and p<0.001 at 96 hours of starvation; t-test; n>3 samples/condition/timepoint; lipids extracted from 5 flies/sample). Data are represented as mean ± SEM. RU486 was provided in the media after eclosion at a concentration of 25µg/ml (E, F) and 100µg/ml for all other figures.
Figure 6
Figure 6. Intestinal AMPK activation induces autophagy in the brain and slows muscle aging
(A) Expression levels of autophagy genes in heads of 10 day old TIGS-2>UAS-mCh-AMPK flies at with or without RU486-mediated transgene induction. (t-test; n>3 of RNA extracted from 10 heads/replicate). (B) Brain GFP-Atg8a Staining. Representative images from optic lobes of 10 day old TIGS-2>UAS-mCH-AMPK, pGFP-Atg8a females with or without RU486-mediated transgene expression (red channel-phalloidin, green channel-GFP-Atg8a, scale bar represents 10µm). (C) Quantification of brain GFP-Atg8a foci (p<0.007; t-test; n>10 confocal stacks from optic lobes/condition; one brain/replicate stack). (D) Confocal imaging of flight muscle of TIGS-2>UAS-mCh-AMPK females with or without RU486-mediated transgene induction showing protein polyubiquitinated aggregates at young (10 days), and old (30 days) timepoints (red channel-phalloidin/F-actin, green channel- anti-polyubiquitin, scale bar represents 10µm). (E) Quantification of polyubiquitin aggregates in muscle (p<0.01; t-test; n>10; one fly/replicate stack). (F) Western blot detection of total ubiquitin-conjugated proteins from thorax detergent-insoluble extracts of young (10 days) and aged (30 days) TIGS-2>UAS-mCh-AMPK females with or without RU486-mediated transgene induction. (G) Densitometry of ubiquitin blots (p<0.001; t-test; n=4 samples/condition; 10 thoraces/sample). (H) Climbing activity of TIGS-2>UAS-mCh-AMPK females with or without RU486-mediated transgene induction. (p<0.05; t-test; n=6 vials/condition; 30 flies/vial). Data are represented as mean ± SEM. RU486 was provided in the media after eclosion at a concentration of 100µg/ml.
Figure 7
Figure 7. Inter-tissue effects of AMPK/Atg1 are linked to altered insulin-like signaling
(A) Representative images of DILP2 antibody stained insulin producing cells (IPCs) from 10 day old ELAV-GS>UAS-mCh-AMPK female flies with or without RU486-mediated transgene induction (green channel - Dilp2 antibody, blue channel phalloidin, scale bars represent 10µm). (B) Quantification of DILP2 signal from IPCs of 10 day old ELAV-GS>UAS-mCh-AMPK female flies with or without RU486-mediated transgene induction. (p<0.01; t-test; n>10 brains/condition). (C) Expression level of dilp genes from dissected heads of 10 day old ELAV-GS>UAS-mCh-AMPK female flies with or without RU486-mediated transgene induction. (p<0.01; t-test; n>3 of RNA extracted from 10 heads /replicate). (D) Expression level of 4E-BP from dissected body parts of 10 day old ELAV-GS>UAS-mCh-AMPK female flies with or without RU486-mediated transgene induction. (p<0.01; t-test; n=3 of RNA extracted from 10 body parts/replicate). (E) Representative images of DILP2 antibody stained IPCs from 10 day old ELAV-GS>UAS-Atg1 female flies (green channel - Dilp2 antibody, blue channel phalloidin, scale bars represent 10µm). (F) Quantification of DILP2 signal from IPCs of 10 day old ELAV-GS>UAS-Atg1 female flies with or without RU486-mediated transgene induction. (p<0.01; t-test; n>10 brains/condition). (G) Expression level of dilp genes from dissected heads of 10 day old ELAV-GS>UAS-Atg1 female flies with or without RU486-mediated transgene induction. (p<0.05; t-test; n>3 of RNA extracted from 10 heads /replicate). (H) Expression level of 4E-BP from dissected body parts of 10 day old ELAV-GS>UAS-Atg1 female flies with or without RU486-mediated transgene induction. (p<0.05; t-test; n=3 of RNA extracted from 10 body parts/replicate). (I) Representative images of DILP2 antibody stained IPCs from 10 day old TIGS-2>UAS-mCh-AMPK female flies (green channel - Dilp2 antibody, blue channel -phalloidin, scale bars represent 10µm) with or without RU486-mediated transgene induction. (J) Quantification of DILP2 signal from IPCs of 10 day old TIGS-2>UAS-mCh-AMPK female flies with or without RU486-mediated transgene induction. (p<0.001; t-test; n>10 brains/condition). (K) Expression level of dilp genes from dissected heads of 10 day old TIGS-2>UAS-mCh-AMPK female flies with or without RU486-mediated transgene induction. (p<0.05; t-test; n=3 of RNA extracted from 10 heads /replicate). (L) Expression level of 4E-BP from dissected body parts of 10 day old TIGS-2>UAS-mCh-AMPK female flies with or without RU486-mediated transgene induction. (p<0.05; t-test; n=3 of RNA extracted from 10 body parts/replicate). Data are represented as mean ± SEM. RU486 was provided in the media after eclosion at the following concentrations (A-D 25µg/ml) (E-H 50µg/ml)(I-L 100µg/ml).

Similar articles

Cited by

References

    1. Alers S, Loffler AS, Wesselborg S, Stork B. Role of AMPK-mTOR-Ulk1/2 in the regulation of autophagy: cross talk, shortcuts, and feedbacks. Molecular and cellular biology. 2012;32:2–11. - PMC - PubMed
    1. Alic N, Tullet JM, Niccoli T, Broughton S, Hoddinott MP, Slack C, Gems D, Partridge L. Cell-nonautonomous effects of dFOXO/DAF-16 in aging. Cell reports. 2014;6:608–616. - PMC - PubMed
    1. Alvers AL, Wood MS, Hu D, Kaywell AC, Dunn WA, Jr, Aris JP. Autophagy is required for extension of yeast chronological life span by rapamycin. Autophagy. 2009;5:847–849. - PMC - PubMed
    1. Apfeld J, O'Connor G, McDonagh T, DiStefano PS, Curtis R. The AMP-activated protein kinase AAK-2 links energy levels and insulin-like signals to lifespan in C. elegans. Genes & development. 2004;18:3004–3009. - PMC - PubMed
    1. Bai H, Kang P, Hernandez AM, Tatar M. Activin signaling targeted by insulin/dFOXO regulates aging and muscle proteostasis in Drosophila. PLoS genetics. 2013;9:e1003941. - PMC - PubMed

Publication types

MeSH terms

Substances