

Adiponectin induces A20 expression in adipose tissue to confer metabolic benefit
- PMID: 25190567
- PMCID: PMC4396702
- DOI: 10.2337/db13-1835
Adiponectin induces A20 expression in adipose tissue to confer metabolic benefit
Abstract
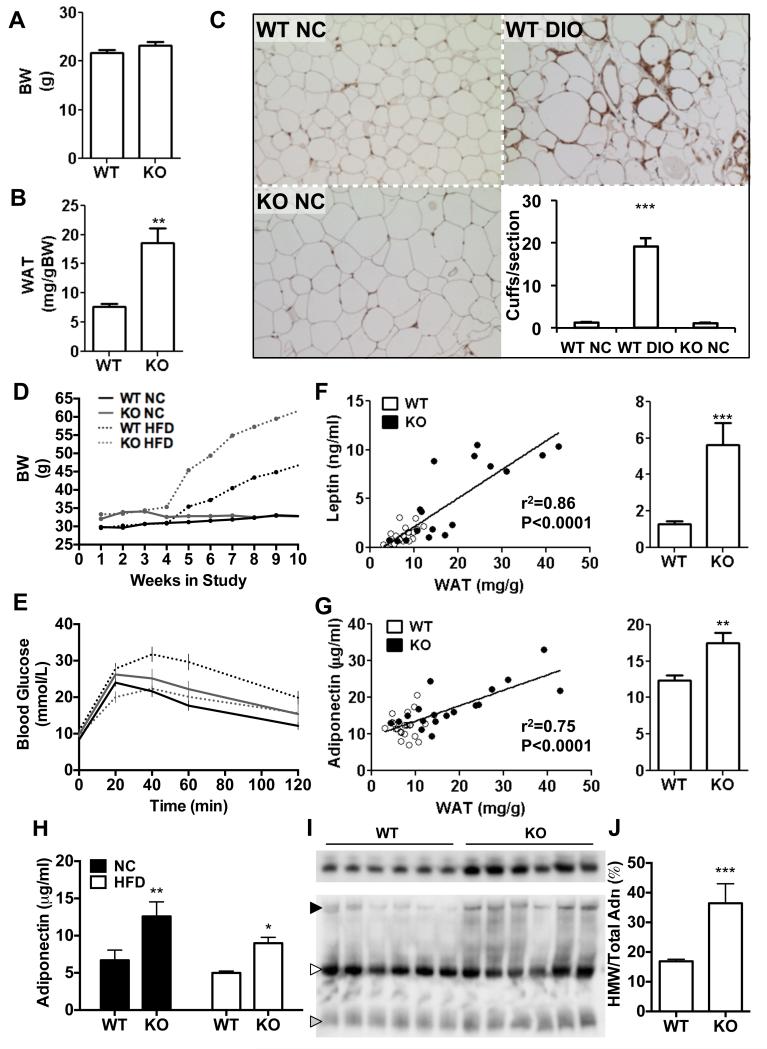
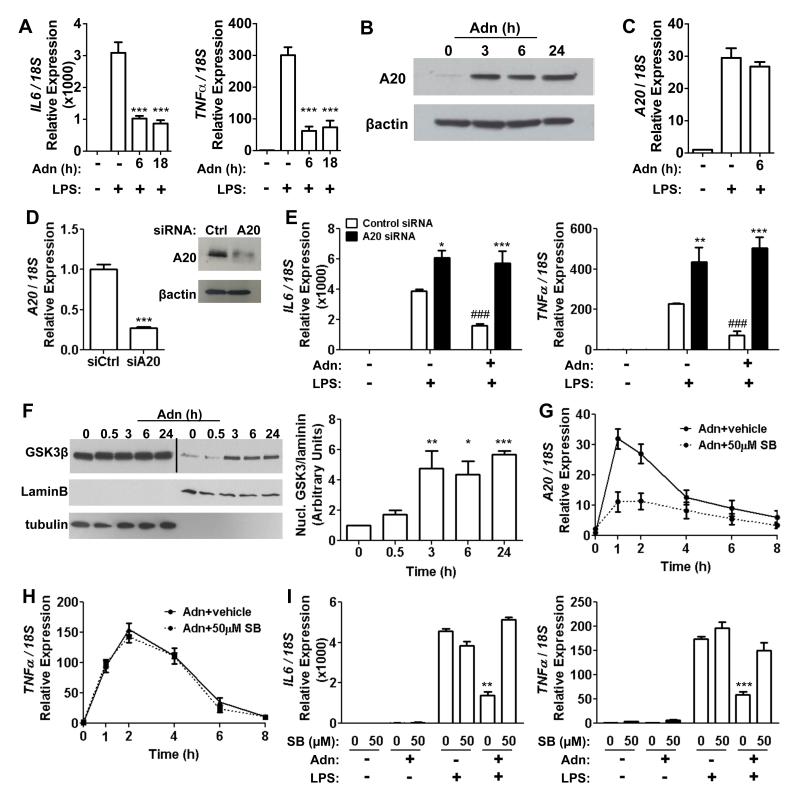
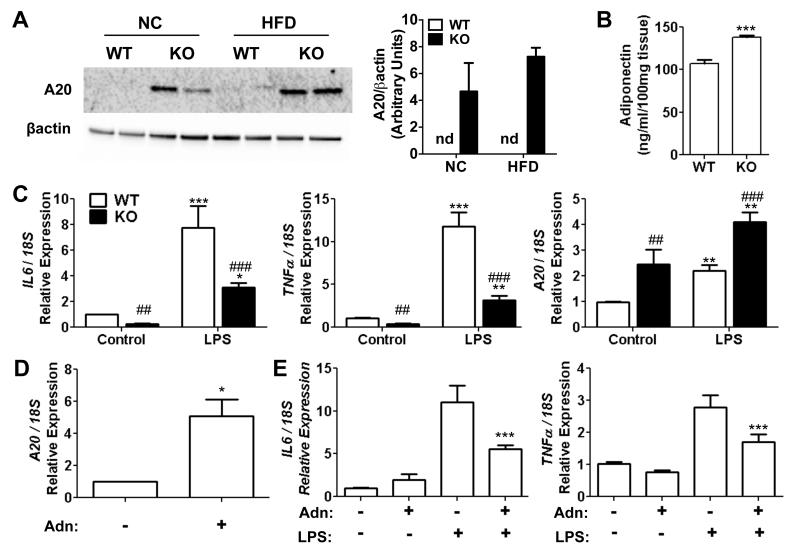
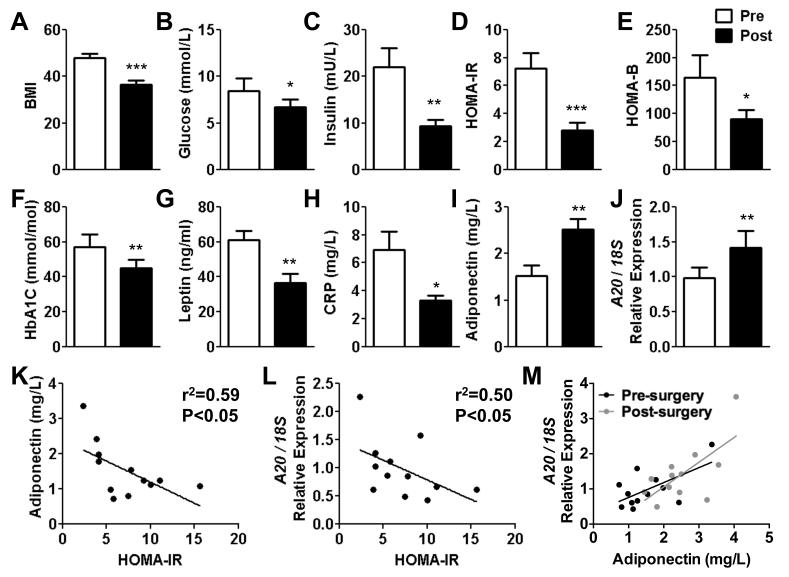
Obesity is a major risk factor for metabolic disease, with white adipose tissue (WAT) inflammation emerging as a key underlying pathology. We detail that mice lacking Reverbα exhibit enhanced fat storage without the predicted increased WAT inflammation or loss of insulin sensitivity. In contrast to most animal models of obesity and obese human patients, Reverbα(-/-) mice exhibit elevated serum adiponectin levels and increased adiponectin secretion from WAT explants in vitro, highlighting a potential anti-inflammatory role of this adipokine in hypertrophic WAT. Indeed, adiponectin was found to suppress primary macrophage responses to lipopolysaccharide and proinflammatory fatty acids, and this suppression depended on glycogen synthase kinase 3β activation and induction of A20. Attenuated inflammatory responses in Reverbα(-/-) WAT depots were associated with tonic elevation of A20 protein and ex vivo shown to depend on A20. We also demonstrate that adipose A20 expression in obese human subjects exhibits a negative correlation with measures of insulin sensitivity. Furthermore, bariatric surgery-induced weight loss was accompanied by enhanced WAT A20 expression, which is positively correlated with increased serum adiponectin and improved metabolic and inflammatory markers, including C-reactive protein. The findings identify A20 as a mediator of adiponectin anti-inflammatory action in WAT and a potential target for mitigating obesity-related pathology.
© 2015 by the American Diabetes Association. Readers may use this article as long as the work is properly cited, the use is educational and not for profit, and the work is not altered.
Figures
Similar articles
-
Twist1 in human white adipose tissue and obesity.J Clin Endocrinol Metab. 2011 Jan;96(1):133-41. doi: 10.1210/jc.2010-0929. Epub 2010 Oct 13. J Clin Endocrinol Metab. 2011. PMID: 20943789
-
Inflammatory phenotyping identifies CD11d as a gene markedly induced in white adipose tissue in obese rodents and women.J Nutr. 2011 Jun;141(6):1172-80. doi: 10.3945/jn.110.127068. Epub 2011 Apr 20. J Nutr. 2011. PMID: 21508205
-
Recent advances in the relationship between obesity, inflammation, and insulin resistance.Eur Cytokine Netw. 2006 Mar;17(1):4-12. Eur Cytokine Netw. 2006. PMID: 16613757 Review.
-
A high-fish-oil diet prevents adiposity and modulates white adipose tissue inflammation pathways in mice.J Nutr Biochem. 2015 Sep;26(9):960-9. doi: 10.1016/j.jnutbio.2015.04.002. Epub 2015 May 6. J Nutr Biochem. 2015. PMID: 25997866
-
Adiponectin-Resistance in Obesity.Adv Exp Med Biol. 2017;960:415-441. doi: 10.1007/978-3-319-48382-5_18. Adv Exp Med Biol. 2017. PMID: 28585210 Review.
Cited by
-
Adipocyte NR1D1 dictates adipose tissue expansion during obesity.Elife. 2021 Aug 5;10:e63324. doi: 10.7554/eLife.63324. Elife. 2021. PMID: 34350828 Free PMC article.
-
Current research into A20 mediation of allergic respiratory diseases and its potential usefulness as a therapeutic target.Front Immunol. 2023 Mar 28;14:1166928. doi: 10.3389/fimmu.2023.1166928. eCollection 2023. Front Immunol. 2023. PMID: 37056760 Free PMC article. Review.
-
A20: a master regulator of arthritis.Arthritis Res Ther. 2020 Sep 21;22(1):220. doi: 10.1186/s13075-020-02281-1. Arthritis Res Ther. 2020. PMID: 32958016 Free PMC article. Review.
-
Decabromodiphenyl ether causes insulin resistance and glucose and lipid metabolism disorders in mice.World J Diabetes. 2021 Aug 15;12(8):1267-1281. doi: 10.4239/wjd.v12.i8.1267. World J Diabetes. 2021. PMID: 34512892 Free PMC article.
-
The cost of circadian desynchrony: Evidence, insights and open questions.Bioessays. 2015 Jul;37(7):777-88. doi: 10.1002/bies.201400173. Epub 2015 May 22. Bioessays. 2015. PMID: 26010005 Free PMC article. Review.
References
-
- Dalmas E, Clément K, Guerre-Millo M. Defining macrophage phenotype and function in adipose tissue. Trends Immunol. 2011;32:307–314. - PubMed
-
- Hotamisligil GS, Shargill NS, Spiegelman BM. Adipose expression of tumor necrosis factor-alpha: direct role in obesity-linked insulin resistance. Science. 1993;259:87–91. - PubMed
Publication types
MeSH terms
Substances
Grants and funding
LinkOut - more resources
Full Text Sources
Other Literature Sources
Medical
Molecular Biology Databases
Research Materials
Miscellaneous
