. 2014 Aug 27;34(35):11844-56.
doi: 10.1523/JNEUROSCI.4642-12.2014.

MHC class I limits hippocampal synapse density by inhibiting neuronal insulin receptor signaling

Affiliations

MHC class I limits hippocampal synapse density by inhibiting neuronal insulin receptor signaling

Tracy J Dixon-Salazar et al. J Neurosci. .

Abstract

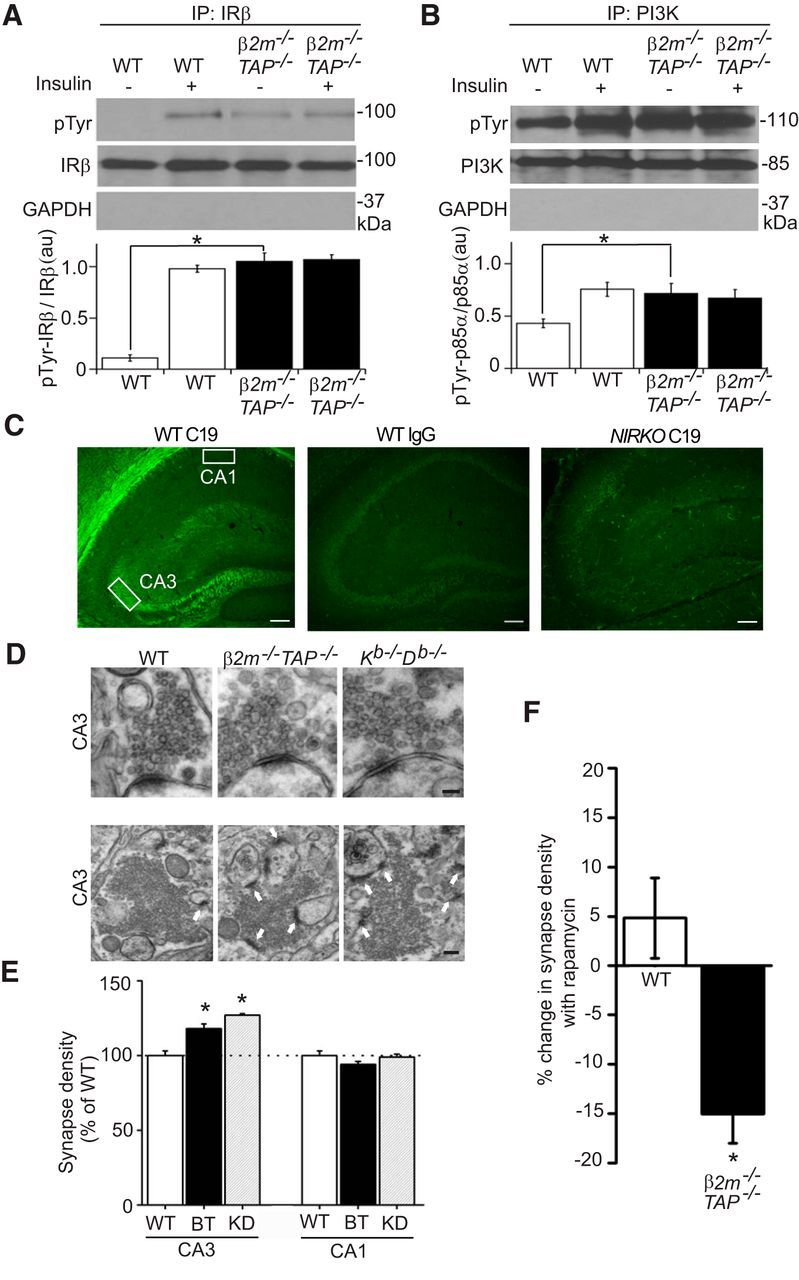
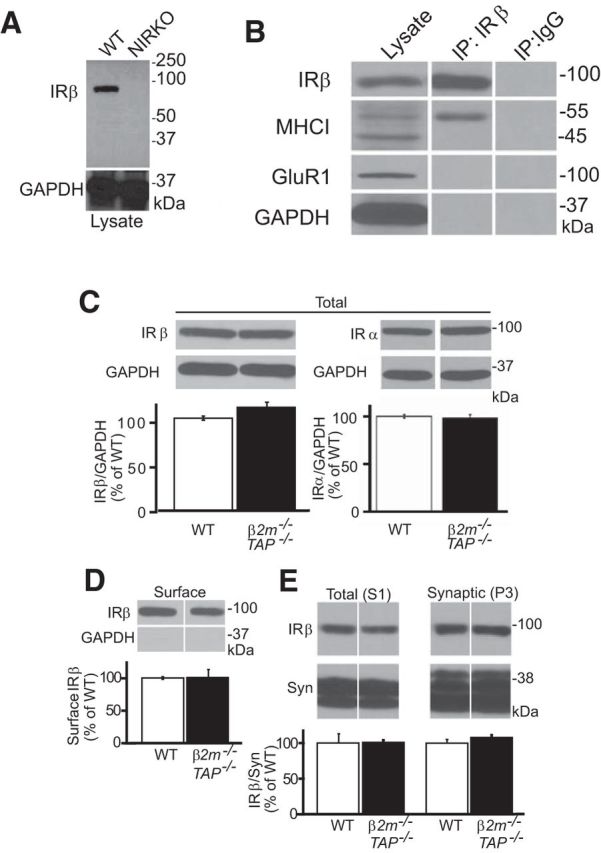
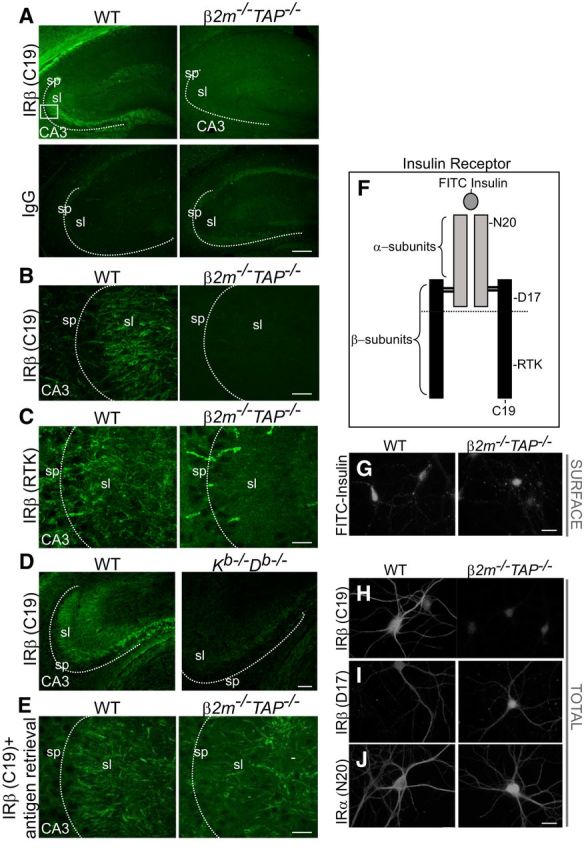
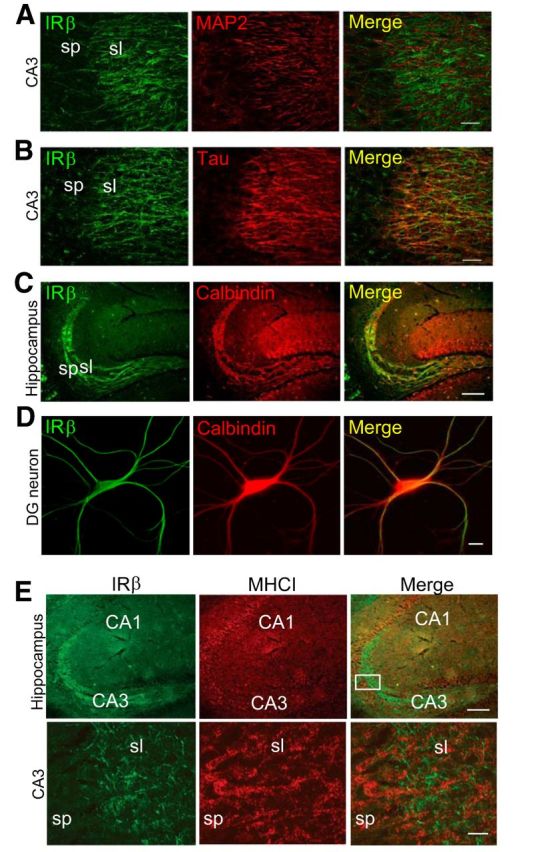
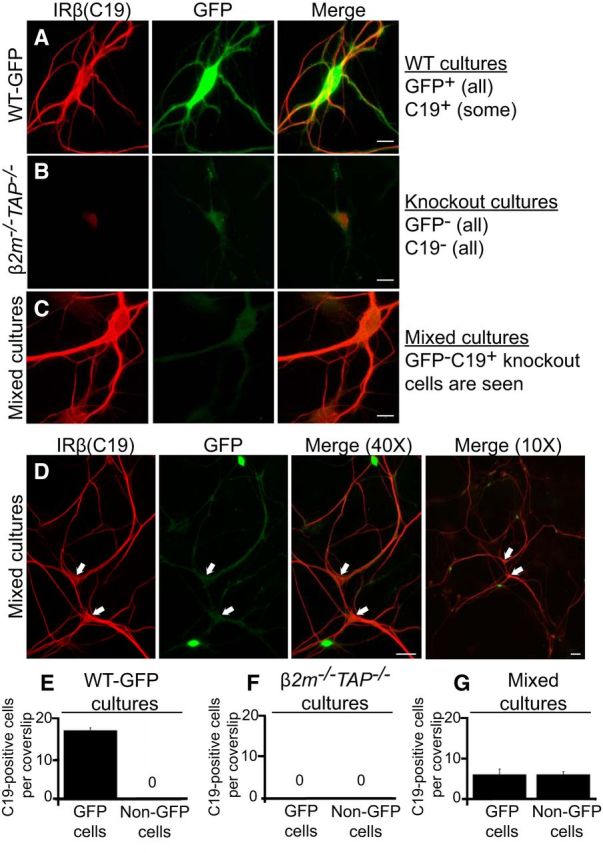
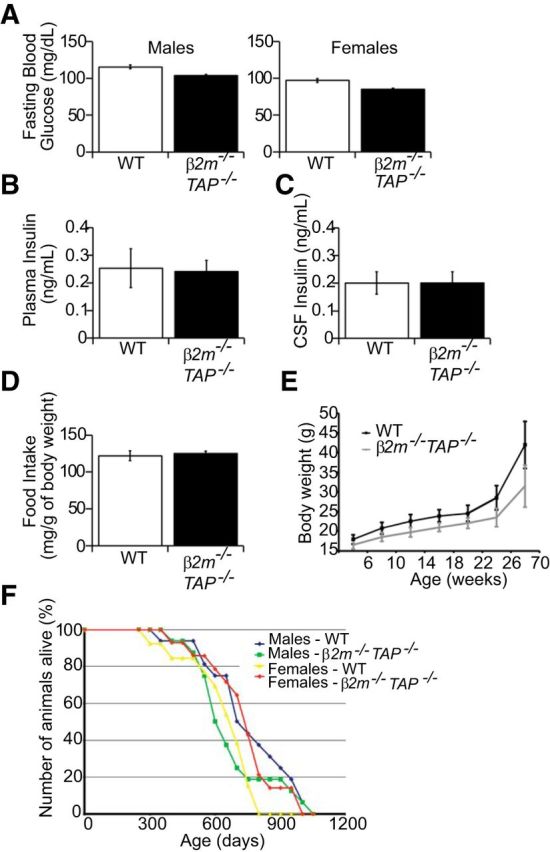
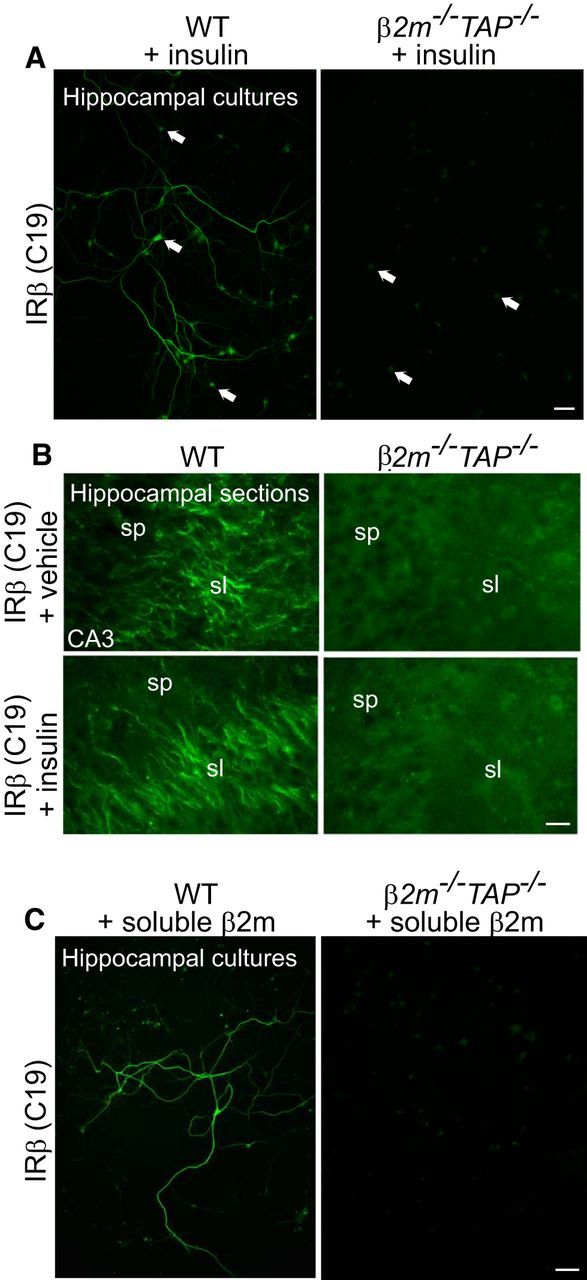
Proteins of the major histocompatibility complex class I (MHCI) negatively regulate synapse density in the developing vertebrate brain (Glynn et al., 2011; Elmer et al., 2013; Lee et al., 2014), but the underlying mechanisms remain largely unknown. Here we identify a novel MHCI signaling pathway that involves the inhibition of a known synapse-promoting factor, the insulin receptor. Dominant-negative insulin receptor constructs decrease synapse density in the developing Xenopus visual system (Chiu et al., 2008), and insulin receptor activation increases dendritic spine density in mouse hippocampal neurons in vitro (Lee et al., 2011). We find that genetically reducing cell surface MHCI levels increases synapse density selectively in regions of the hippocampus where insulin receptors are expressed, and occludes the neuronal insulin response by de-repressing insulin receptor signaling. Pharmacologically inhibiting insulin receptor signaling in MHCI-deficient animals rescues synapse density, identifying insulin receptor signaling as a critical mediator of the tonic inhibitory effects of endogenous MHCI on synapse number. Insulin receptors co-immunoprecipitate MHCI from hippocampal lysates, and MHCI unmasks a cytoplasmic epitope of the insulin receptor that mediates downstream signaling. These results identify an important role for an MHCI-insulin receptor signaling pathway in circuit patterning in the developing brain, and suggest that changes in MHCI expression could unexpectedly regulate neuronal insulin sensitivity in the aging and diseased brain.


Figures

Figure 1.
Figure 1.
MHCI inhibits constitutive insulin receptor signaling and limits synapse density in regions where IRs are expressed. A, B, Insulin receptor β subunits (IRβ) or PI3K immunoprecipitated from WT or β2m−/−TAP−/− hippocampal lysates prepared from live brain slices incubated in the presence or absence of insulin, probed for phosphotyrosine (pTyr), insulin receptor β (IRβ; C19), PI3K, or the abundant intracellular protein GAPDH. While total levels of insulin receptor and PI3K proteins are normal, the proportion of insulin receptor and PI3K that is phosphorylated in the basal state is significantly elevated in β2m−/−TAP−/− hippocampus. Histograms show the mean pTyr labeling intensity normalized to total insulin receptor or PI3K labeling within the experiment ±SEM, reported in arbitrary units (a.u.). A, IR: WT minus insulin, 0.11 ± 0.03; WT plus insulin, 0.98 ± 0.03; β2m−/−TAP−/− minus insulin, 1.05 ± 0.08 (p < 0.01 compared with WT minus insulin, Student's t test); β2m−/−TAP−/− with insulin, 1.07 ± 0.05; n = 3 animals per genotype per condition. B, PI3K: WT minus insulin, 43.10 ± 4.17; WT plus insulin, 75.57 ± 6.59; β2m−/−TAP−/− minus insulin, 71.74 ± 9.58 (p < 0.01 compared with WT minus insulin, Student's t test); β2m−/−TAP−/− with insulin, 67.14 ± 8.21; n = 3 animals per genotype per condition. C, Coronal sections of P30 mouse hippocampus immunostained with IRβ (C19) antibodies show strong, specific labeling of the proximal neuropil in area CA3, but not area CA1, of hippocampus. Labeling is abolished when WT sections are incubated in isotype control primary antibodies (middle) or in brain sections from NIRKO mice (right). Left, Boxes represent regions where electron micrographs were collected. Scale bar, 100 μm. D, Top, Representative transmission electron micrographs of single synapses in stratum lucidum of CA3 from WT and MHCI-deficient mice (β2m−/−TAP−/− and Kb−/−Db−/− mice). Scale bar, 150 nm. Bottom, Representative lower-magnification transmission electron micrographs from stratum lucidum of CA3 from WT β2m−/−TAP−/− and Kb−/−Db−/− mice showing multiple synapses (arrows). Scale bar, 250 nm. E, Synapse counts per unit area. β2m−/−TAP−/− and Kb−/−Db−/− mice show increased synapse density compared with WT mice in area CA3, where insulin receptors are expressed, but not in CA1, where insulin receptors are not detected. Values represent the mean ± SEM. Mean number of synapses per square micrometer in CA3: WT, 0.34 ± 0.01 synapses, n = 6 animals; β2m−/−TAP−/−, 0.40 ± 0.01, n = 6, p < 0.02; Kb−/−Db−/−, 0.43 ± 0.01, n = 3, p < 0.01, Student's t test. BT, β2m−/−TAP−/−; KD, Kb−/−D b−/−. Mean synapse density in CA3 is 17.7% higher in β2m−/−TAP−/− than WT mice. F, Rapamycin reduces synapse number in area CA3 of β2m−/−TAP−/− but not WT mice. Mean synapse density in β2m−/−TAP−/− declines an average of 15.0% after treatment with rapamycin, significantly different from the effect in WT (p = 0.02); n = 3 slices per genotype. IP, Immunoprecipitation. *p < 0.05.
Figure 2.
Figure 2.
MHCI and insulin receptors coimmunoprecipitate from WT hippocampal lysates, and insulin receptor expression and trafficking is normal in MHCI-deficient mice. A, Western blots of whole-brain lysates from adult (P30) WT or NIRKO mice probed for IRβ using clone C19. The loss of insulin receptor labeling (IRβ; ∼95 kDa) in NIRKO brain samples as well as the absence of IGF-1 receptor labeling (∼115 kDa) in either genotype demonstrate the specificity of clone C19 for insulin receptors. Bottom, The same samples stripped and reprobed for the abundant intracellular protein GAPDH. B, Western blotting for MHCI and IRβ in hippocampal lysates or IRβ immunoprecipitates. IRβ antibodies selectively coprecipitate MHCI, but not other cell surface (GluR1) or intracellular (GAPDH) proteins. IP:IgG, Isotype control immunoprecipitation. C, D, Western blotting of WT and β2m−/−TAP−/− hippocampal lysates probed for IRβ (C19) or IRα (N20) subunits (C), and hippocampal cell surface fractions probed for IRβ (C19; D). Total and surface levels of insulin receptor protein are indistinguishable between genotypes. Insulin receptor values are normalized to GAPDH and represented as the percentage of WT (mean ± SEM). Total IRβ: WT, 100 ± 2.3%; β2m−/−TAP−/−, 111.6 ± 5.5%; n = 6 animals. Total IRα: WT, 102 ± 1.3%; β2m−/−TAP−/−, 99.1 ± 4.5%; n = 3. Surface: WT, 100 ± 2.0%; β2m−/−TAP−/−, 101 ± 12.4%; n = 3. E, Western blots of total (S1) and synaptic (P3) fractions from hippocampus probed for IRβ (C19) and the presynaptic protein synaptophysin (Syn). Synaptic levels of insulin receptor protein are indistinguishable between genotypes. S1: WT, 100 ± 13.0%; β2m−/−TAP−/−, 100 ± 3.0%; n = 6 animals; P3: WT, 100 ± 5.0%; β2m−/−TAP−/−, 108 ± 4.0%; n = 6.
Figure 3.
Figure 3.
Occlusion of insulin receptor epitopes in MHCI-deficient brain. A, P30 mouse hippocampus immunostained with IRβ (C19) antibodies or IgG control. IRβ labeling is strong in WT brain but is abolished in brains of β2m−/−TAP−/− mice. sp, Stratum pyramidale; sl, stratum lucidum. Box represents the approximate area shown in B, C, and E. Scale bar, 150 μm. B, Scale bar, 20 μm. C, IRβ staining with the RTK antibody in WT brain is abolished in β2m−/−TAP−/− brain, similar to the loss of IRβ (C19) staining in A and B. Only nonspecific blood vessel labeling persists in β2m−/−TAP−/−. Scale bar, 20 μm. D, IRβ (C19) staining is also reduced in sections from mice lacking the MHCI proteins H2-K and H2-D (Kb−/−Db−/− mice). Scale bar, 100 μm. E, WT and β2m−/−TAP−/− hippocampi stained for IRβ (C19) after antigen retrieval. IRβ immunolabeling with this antibody is abolished in β2m−/−TAP−/− brains under normal immunostaining conditions (A, B), but is restored following antigen retrieval. Scale bar, 20 μm. F, Schematic representation of insulin receptors, which are composed of two extracellular α-subunits and two transmembrane β-subunits. Approximate locations of epitopes detected by individual reagents are indicated. Horizontal line represents the transmembrane region. G, Labeling of cell surface insulin-binding receptors in live WT and β2m−/−TAP−/− hippocampal neurons using FITC-insulin. FITC-insulin labeling is qualitatively similar in level and pattern in WT and β2m−/−TAP−/− neurons. Scale bar, 20 μm. H–J, Labeling of the total (surface plus intracellular) pool of insulin receptors in fixed, permeabilized hippocampal neurons using antibodies directed against the indicated epitopes. Labeling with IRβ (C19) is abolished in β2m−/−TAP−/− neurons (H), as is staining with IRβ (RTK), which binds a nearby epitope (Fig. 3C,F,H). I, J, However, insulin receptor protein is readily detectable in β2m−/−TAP−/− neurons when labeled with antibodies against distinct epitopes in the IRβ (D17; I) or IRα (N20; J) subunits. Scale bar, 10 μm.
Figure 4.
Figure 4.
Insulin receptors are expressed by axons in hippocampus and do not localize to the same cellular compartments as MHCI, consistent with non-cell-autonomous interactions. A, B, Double-label immunohistochemistry for IRβ (green) and the dendritic marker MAP2 (red) or the axonal marker TAU (red). IRβ does not colocalize with MAP2 (yellow, merge in A), but colocalizes with TAU (yellow, merge in B) in area CA3 stratum lucidum of WT hippocampus. Scale bars, 20 μm. C, Double labeling for IRβ (green) and the dentate granule cell marker calbindin (red). IRβ and calbindin colocalize extensively in dentate granule cell axons (mossy fibers). Scale bar, 100 μm. D, Double-label cytochemistry for IRβ (green) and calbindin (red) in WT hippocampal cultures at 18 DIV. IRβ labeling colocalizes with calbindin-positive neurons (yellow, merge). Scale bar, 10 μm. E, P30 mouse hippocampus immunostained for IRβ (green) and MHCI (red). Boxed region (top right) is magnified in bottom. Punctate MHCI labeling is detected in processes in apposition to IRβ-positive axons in stratum lucidum of hippocampus (merge). sp, Stratum pyramidale; sl, stratum lucidum. Scale bars: top, 100 μm; bottom, 10 μm.
Figure 5.
Figure 5.
Insulin receptor β (C19) immunolabeling is rescued in MHCI-deficient neurons cocultured with WT neurons. A–D, Cultured hippocampal neurons (18 DIV) stained for IRβ (C19, red) and GFP (green). A, Example of IRβ and GFP labeling in pure WT-GFP hippocampal cultures. These cultures contain both IRβ-positive neurons (dentate granule cells) and IRβ-negative neurons, and all neurons are GFP positive. Scale bar, 10 μm. B, Example of IRβ and GFP labeling in pure β2m−/−TAP−/− cultures. These cultures do not contain any IRβ-positive or GFP-positive neurons, as expected. Scale bar, 10 μm. C, Example of IRβ and GFP labeling in mixed WT-GFP and β2m−/−TAP−/− cultures. In mixed cultures, IRβ staining is rescued in a subset of β2m−/−TAP−/− (GFP-negative) neurons. Scale bar, 10 μm. D, Low-power views of mixed cultures allow clear identification of GFP-negative, C19-positive cells (arrows). Scale bars: 40× view, 50 μm; 10× view, 20 μm. E–G, Quantification of IRβ-positive cells. E, At the density plated, WT-GFP cultures contain on average 17 ± 0.70 C19-positive cells per coverslip (of ∼300 cells/coverslip). F, β2m−/−TAP−/− cultures do not contain any C19-positive cells. G, Cultures plated with equal numbers of WT-GFP and β2m−/−TAP−/− neurons contain two populations of C19-expressing cells in equal numbers: those that are GFP positive (WT; 6 ± 1.4 cells/coverslip), and those that are GFP negative (rescued β2m−/−TAP−/−; 6 ± 0.8 cells/coverslip). All bars represent mean ± SEM; n = 3 cultures, at 12 coverslips per culture, each for EG.
Figure 6.
Figure 6.
Blood glucose levels, plasma and CSF insulin levels, food intake, body weight, and life span are unchanged in β2m−/−TAP−/− mice. A, Blood glucose levels for male and female 6-month-old β2m−/−TAP−/− mice fasted for 24 h are comparable to WT animals. WT males: 115.6 ± 2.5 g/dL, n = 12 animals; β2m−/−TAP−/− males: 103.9 ± 1.3, n = 19; WT females: 96.9 ± 2.5, n = 18; β2m−/−TAP−/− females: 85 ± 1.6, n = 19. B, Plasma insulin levels are similar as measured by Ultrasensitive Enzyme Immunoassay (EIA) in P30–P35 WT and β2m−/−TAP−/− mice. WT: 0.25 ± 0.07 ng/ml, n = 14 animals; β2m−/−TAP−/−: 0.24 ± 0.04, n = 9. C, CSF insulin levels as measured by EIA are comparable between WT and β2m−/−TAP−/− P30–P35 mice. WT: 0.19 ± 0.04 ng/ml, n = 15 animals; β2m−/−TAP−/−: 0.20 ± 0.04, n = 9. D, Food intake measurements normalized to body weight in mice at 20 weeks of age show no significant difference between WT and β2m−/−TAP−/−. WT: 121.1 ± 6.6 mg/g body weight, n = 36 animals; β2m−/−TAP−/−: 125 ± 3.4, n = 32. E, Body weight measurements in WT and β2m−/−TAP−/− mice from 6 to 70 weeks of age. β2m−/−TAP−/− mice on a regular chow diet weighed slightly less than controls at all ages, but this difference was not statistically significant at any age measured (n = 13–17 mice per genotype and sex). F, Average life span is unchanged in β2m−/−TAP−/− mice relative to WT (n > 13 for each genotype and gender). For A–E, values are mean ± SEM, and Student's t test shows no significant difference between genotypes. For all measures, there were no significant differences between genotypes for males or females analyzed separately, and therefore (B–D) show pooled data for male and female β2m−/−TAP−/− mice versus age- and sex-matched controls.
Figure 7.
Figure 7.
Immunostaining of insulin receptor β is not rescued in β2m−/−TAP−/− neurons by treatment with either soluble β2m or insulin. A, WT and β2m−/−TAP−/− hippocampal neurons (19 DIV) treated with insulin, then fixed and stained for IRβ. Insulin application does not rescue the loss of C19 staining in β2m−/−TAP−/− neurons. Scale bar, 50 μm. B, Live WT and β2m−/−TAP−/− mouse hippocampal slices incubated with vehicle or soluble insulin, then fixed and stained with IRβ antibodies (C19). Bath application of insulin (bottom) does not rescue the loss of C19 staining in β2m−/−TAP−/− neurons. Scale bar, 20 μm. C, WT and β2m−/−TAP−/− hippocampal neurons (19 DIV) treated with soluble β2m, then fixed and immunostained for IRβ. Bath application of β2m does not rescue the loss of C19 staining in β2m−/−TAP−/− neurons. Scale bar, 50 μm.

Similar articles

Cited by

References

    1. Abbott MA, Wells DG, Fallon JR. The insulin receptor tyrosine kinase substrate p58/53 and the insulin receptor are components of CNS synapses. J Neurosci. 1999;19:7300–7308. - PMC - PubMed
    1. Akiyama H, Barger S, Barnum S, Bradt B, Bauer J, Cole GM, Cooper NR, Eikelenboom P, Emmerling M, Fiebich BL, Finch CE, Frautschy S, Griffin WS, Hampel H, Hull M, Landreth G, Lue L, Mrak R, Mackenzie IR, McGeer PL, et al. Inflammation and Alzheimer's disease. Neurobiol Aging. 2000;21:383–421. doi: 10.1016/S0197-4580(00)00124-X. - DOI - PMC - PubMed
    1. Alexandraki K, Piperi C, Kalofoutis C, Singh J, Alaveras A, Kalofoutis A. Inflammatory process in type 2 diabetes: the role of cytokines. Ann N Y Acad Sci. 2006;1084:89–117. doi: 10.1196/annals.1372.039. - DOI - PubMed
    1. Baron-Van Evercooren A, Olichon-Berthe C, Kowalski A, Visciano G, Van Obberghen E. Expression of IGF-I and insulin receptor genes in the rat central nervous system: a developmental, regional, and cellular analysis. J Neurosci Res. 1991;28:244–253. doi: 10.1002/jnr.490280212. - DOI - PubMed
    1. Baudler S, Baumgartl J, Hampel B, Buch T, Waisman A, Snapper CM, Krone W, Brüning JC. Insulin-like growth factor-1 controls type 2 T cell-independent B cell response. J Immunol. 2005;174:5516–5525. doi: 10.4049/jimmunol.174.9.5516. - DOI - PubMed

Publication types

MeSH terms

Substances