. 2014 Aug 26;7(340):ra82.
doi: 10.1126/scisignal.2005287.

Diacylglycerol kinase α establishes T cell polarity by shaping diacylglycerol accumulation at the immunological synapse

Affiliations

Diacylglycerol kinase α establishes T cell polarity by shaping diacylglycerol accumulation at the immunological synapse

Anne Chauveau et al. Sci Signal. .

Abstract

Polarization of the T cell microtubule-organizing center (MTOC) to the immunological synapse between the T cell and an antigen-presenting cell (APC) maintains the specificity of T cell effector responses by enabling directional secretion toward the APC. The reorientation of the MTOC is guided by a sharp gradient of the second messenger diacylglycerol (DAG), which is centered at the immunological synapse. We used a single-cell photoactivation approach to demonstrate that diacylglycerol kinase α (DGK-α), which catalyzes the conversion of DAG to phosphatidic acid, determined T cell polarity by limiting the diffusion of DAG. DGK-α-deficient T cells exhibited enlarged accumulations of DAG at the immunological synapse, as well as impaired reorientation of the MTOC. In contrast, T cells lacking the related isoform DGK-ζ did not display polarization defects. We also found that DGK-α localized preferentially to the periphery of the immunological synapse, suggesting that it constrained the area over which DAG accumulated. Phosphoinositide 3-kinase activity was required for the peripheral localization pattern of DGK-α, which suggests a link between DAG and phosphatidylinositol signaling during T cell activation. These results reveal a previously unappreciated function of DGK-α and provide insight into the mechanisms that determine lymphocyte polarity.


Figures

Fig. 1
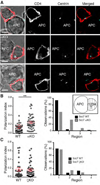
Fig. 1. DGK-α is required for MTOC polarization in T cell-APC conjugates
(A) Wild type (WT) (top), DGK-α−/− (αKO) (middle), or DGK-ζ−/− (ζKO) (bottom) 5C.C7 T cell blasts were incubated with MCC-loaded CH12 target cells (APC), fixed, and stained with anti-CD4 and anti-pericentrin antibodies. Representative images are shown, with the position of the APC indicated by white text. Scale bars = 10 µm. (B–C) Polarization index (see Materials and Methods) was measured for DGK-α−/− (B, n=48 conjugates) or DGK-ζ−/− (C, n≥40 conjugates) T cells along with WT controls. In each panel, data are presented in scatter plot format to the left, and in histogram format to the right after binning the data into four cellular regions proceeding from the IS to the distal pole (represented in the schematic inset in B). Red lines and error bars in scatter plots denote mean and standard error of the mean (s.e.m.), respectively. *** indicates P < 0.001. All data are representative of at least two independent experiments.
Fig. 2
Fig. 2. DGK-α is required for MTOC polarization in TCR photoactivation experiments
(A–C) Wild type (WT), DGK-α−/− (αKO), and DGK-ζ−/− (ζKO) 5C.C7 T cell blasts expressing GFP-tubulin were imaged and stimulated by localized UV irradiation (red circles) on I-Ek-NPE-MCC coated surfaces. (A) Representative time-lapse montages (WT, top, αKO, middle, ζKO, bottom) are shown, with irradiation time indicated by the appearance of white “UV” text. Scale bars = 10 µm. (B–C) Quantification of MTOC polarization for ζKO (B) and αKO (C) 5C.C7 T cell blasts (n≥16 cells for each condition). Left, average distance between the MTOC and the center of the irradiated region plotted against time, with the purple line indicating UV irradiation. Right, distance measurements from the second half of all time-lapse experiments (4–8 min) plotted in histogram format. (D) WT or αKO OT-1 CTLs (n=15 cells) were subjected to photoactivation experiments as described in A and the data analyzed as in B and C. Error bars in graphs denote s.e.m. P-values were computed using distance measurements from the second half of each time-lapse. All data are representative of at least four independent experiments.
Fig. 3
Fig. 3. The DGK-α−/− polarization phenotype is specific
DGK-α−/− (αKO) 5C.C7 T cells expressing GFP-labeled wild type DGK-α (A and B), KD DGK-α (A), or DGK-ζ (B), together with centrin-2-RFP (an MTOC marker) were imaged and stimulated by localized UV irradiation on I-Ek-NPE-MCC-coated surfaces. Polarization was analyzed by plotting the distance between the MTOC and the irradiated region as a function of time (left) and by plotting distance measurements from the second half of all time-lapse experiments in histogram format (right). Purple lines indicate UV irradiation, and error bars denote s.e.m. n≥10 cells for each curve. P-values were computed using distance measurements from the second half of each time-lapse. Data are representative of at least two independent experiments.
Fig. 4
Fig. 4. DGK-α controls the scope of the DAG gradient
(A) Wild type (WT), DGK-α−/−(αKO), and DGK-ζ−/− (ζKO) 5C.C7 T cells were transduced with C1θ-GFP, incubated on lipid bilayers containing ICAM-1, B7.1, and I-Ek-MCC, fixed, and stained for F-actin. Left, representative TIRF images are shown. Right, linescans (derived from the white lines to the left) showing F-actin and C1θ-GFP fluorescence intensity. Scale bars = 10 µm. (B) Quantification of the relative size of DAG accumulation (see Materials and Methods), calculated by normalizing the diameter of the DAG fluorescence signal to the diameter of the F-actin ring (n>30 cells per condition). Red lines and error bars in the scatter plot denote mean and s.e.m., respectively. **** indicates P < 0.0001 and * indicates P < 0.05. (C) DGK-α+/− (Het) (left) and DGK-α−/− (KO) (right) 5C.C7 T cells expressing C1θ-GFP were imaged and stimulated by localized UV irradiation on I-Ek-NPE-MCC coated surfaces. Representative time-lapse montages are shown, with irradiation time indicated by the appearance of white “UV” text. Scale bars = 10 µm. (D) The average normalized autocorrelation width (see Materials and Methods) of the C1θ-GFP accumulation pattern was plotted against time for both 5C.C7 T cell blasts (left) and OT-1 CTLs (right) (n≥10 cells per curve). Purple lines indicate UV irradiation, and error bars denote s.e.m. P-values in D were computed using averaged autocorrelation measurements from all time points after UV irradiation. All data are representative of at least two independent experiments.
Fig. 5
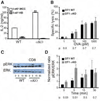
Fig. 5. DGK-α deficiency enhances signaling but not cytotoxicity
(A) WT and αKO T cell blasts were activated on plastic surfaces containing ICAM-1, B7.1, and either stimulatory (MCC) or nonstimulatory (HB) pMHC as indicated. IL-2 secretion was assessed by ELISA. ** indicates P < 0.01. (B) WT and αKO OT-1 CTLs were mixed with OVA-loaded RMA-s target cells at an E:T ratio of 2:1. Specific lysis of RMA-s cells is graphed as a function of OVA concentration. Functional assays in A and B were performed in triplicate. Data are representative of at least three independent experiments. (C) DGK-α+/+ (WT) and DGK-α−/− (αKO) OT-1 T cell blasts were stimulated by CD3/CD28 crosslinking for the indicated times and pErk1/2 levels assessed by immunoblot. Total Erk was used as a loading control. (D) Quantification of pErk1/2 immunoblot band intensity, using data pooled from three independent experiments. P-values refer to pairwise comparisons between WT and αKO. All error bars denote s.e.m.
Fig. 6
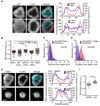
Fig. 6. DGK-α localizes to the periphery of the IS in a PI3K dependent manner
(A) OT-1 CTLs were transduced with GFP-labeled DGK-α or DGK-ζ as indicated, stimulated on bilayers containing H2-Kb-OVA, B7.1, and ICAM-1, fixed, and stained for F-actin. Left, representative TIRF images are shown. Right, linescans (derived from the white lines to the left) showing F-actin and GFP-DGK fluorescence intensity. Scale bars = 10 µm. (B) Quantification of the synaptic localization patterns of the indicated GFP-labeled DGK constructs was performed by comparing the GFP MFI at the center of the IS with the MFI at the periphery (see Materials and Methods) (n≥40 cells per condition). Red lines and error bars in the scatter plot denote mean and s.e.m., respectively. **** indicates P < 0.0001, ** indicates P < 0.01, and * indicates P < 0.05. (C, D) DGK-α−/− 5C.C7 T cell blasts were transduced with GFP-labeled DGK-α (C, D), ΔEF DGK-α (C), or ΔEF2C1 DGK-α (D) together with centrin-2-RFP. The resulting cells were used in TCR photoactivation experiments to assess MTOC polarization. Results were quantified by plotting distance measurements from the second half of all time-lapse experiments in histogram format (n≥10 cells per condition). P-values were computed using distance measurements from the second half of each time-lapse. (E–F) DGK-α−/− OT-1 CTLs expressing GFP-DGK-α were treated with wortmannin (wort) or DMSO (vehicle control), activated on lipid bilayers containing H-2Kb-OVA, ICAM-1, and B7.1, fixed, and stained for F-actin. (E) Left, representative TIRF images are shown. Right, linescans (derived from the white lines to the left) showing F-actin and GFP-DGK-α fluorescence intensity. Scale bars = 10 µm. (F) Synaptic localization of GFP-DGK-α was quantified ratiometrically as in B (n=14 cells per condition). Red lines and error bars in the scatter plot denote mean and s.e.m., respectively. *** indicates P < 0.001. All data are representative of at least three independent experiments.
Fig. 7
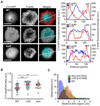
Fig. 7. PI3K activity regulates MTOC polarization and synaptic DAG
(A) Wild type (WT) and DGK-α−/− (αKO) OT-1 CTLs were transduced with C1θ-GFP and incubated on lipid bilayers containing ICAM-1, B7.1 and H-2Kb-OVA in the presence or absence of wortmannin (wort) as indicated. Cells were then fixed and stained for F-actin. Left, representative TIRF images are shown. Right, linescans (derived from the white lines to the left) showing F-actin and C1θ-GFP fluorescence intensity. Scale bars = 10 µm. (B) Quantification of the relative size of DAG accumulation, calculated ratiometrically as described in Fig. 4 (n>30 cells per condition). Red lines and error bars in the scatter plot denote mean and s.e.m., respectively. **** indicates P < 0.0001 and ** indicates P < 0.01. (C) Wild type (WT) and DGK-α−/− (αKO) OT-1 CTLs were transduced with centrin-2-RFP and subjected to TCR photoactivation experiments in the presence or absence of wortmannin as indicated. Polarization was analyzed by plotting distance measurements from the second half of all time-lapse experiments in histogram format. P-values were computed using distance measurements from the second half of each time-lapse. All data are representative of three independent experiments.

Similar articles

Cited by

References

    1. Bornens M. The centrosome in cells and organisms. Science. 2012;335:422. published online EpubJan 27 (335/6067/422 [pii] 10.1126/science.1209037) - PubMed
    1. Huse M, Le Floc’h A, Liu X. From lipid second messengers to molecular motors: microtubule-organizing center reorientation in T cells. Immunol Rev. 2013;256:95. published online EpubNov (10.1111/imr.12116) - PMC - PubMed
    1. Spitaler M, Emslie E, Wood CD, Cantrell D. Diacylglycerol and protein kinase D localization during T lymphocyte activation. Immunity. 2006;24:535. published online EpubMay. - PubMed
    1. Quann EJ, Merino E, Furuta T, Huse M. Localized diacylglycerol drives the polarization of the microtubule-organizing center in T cells. Nat Immunol. 2009;10:627. published online EpubJun. - PubMed
    1. Quann EJ, Liu X, Altan-Bonnet G, Huse M. A cascade of protein kinase C isozymes promotes cytoskeletal polarization in T cells. Nat Immunol. 2011;12:647. published online EpubJul (ni.2033 [pii] 10.1038/ni.2033) - PMC - PubMed

Publication types

MeSH terms

LinkOut - more resources