The NF-κB genomic landscape in lymphoblastoid B cells
- PMID: 25159142
- PMCID: PMC4163118
- DOI: 10.1016/j.celrep.2014.07.037
The NF-κB genomic landscape in lymphoblastoid B cells
Abstract
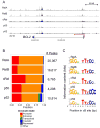
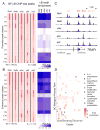
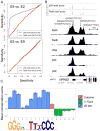
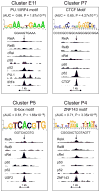
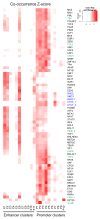
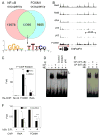
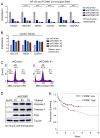
The nuclear factor κB (NF-κΒ) subunits RelA, RelB, cRel, p50, and p52 are each critical for B cell development and function. To systematically characterize their responses to canonical and noncanonical NF-κB pathway activity, we performed chromatin immunoprecipitation followed by high-throughput DNA sequencing (ChIP-seq) analysis in lymphoblastoid B cell lines (LCLs). We found a complex NF-κB-binding landscape, which did not readily reflect the two NF-κB pathway paradigms. Instead, 10 subunit-binding patterns were observed at promoters and 11 at enhancers. Nearly one-third of NF-κB-binding sites lacked κB motifs and were instead enriched for alternative motifs. The oncogenic forkhead box protein FOXM1 co-occupied nearly half of NF-κB-binding sites and was identified in protein complexes with NF-κB on DNA. FOXM1 knockdown decreased NF-κB target gene expression and ultimately induced apoptosis, highlighting FOXM1 as a synthetic lethal target in B cell malignancy. These studies provide a resource for understanding mechanisms that underlie NF-κB nuclear activity and highlight opportunities for selective NF-κB blockade.
Copyright © 2014 The Authors. Published by Elsevier Inc. All rights reserved.
Conflict of interest statement
The authors declare they have no competing financial interests.
Figures
Similar articles
-
A roadmap of constitutive NF-κB activity in Hodgkin lymphoma: Dominant roles of p50 and p52 revealed by genome-wide analyses.Genome Med. 2016 Mar 17;8(1):28. doi: 10.1186/s13073-016-0280-5. Genome Med. 2016. PMID: 26988706 Free PMC article.
-
Reciprocal Regulation Between Forkhead Box M1/NF-κB and Methionine Adenosyltransferase 1A Drives Liver Cancer.Hepatology. 2020 Nov;72(5):1682-1700. doi: 10.1002/hep.31196. Epub 2020 Oct 1. Hepatology. 2020. PMID: 32080887 Free PMC article.
-
Double plant homeodomain (PHD) finger proteins DPF3a and -3b are required as transcriptional co-activators in SWI/SNF complex-dependent activation of NF-κB RelA/p50 heterodimer.J Biol Chem. 2012 Apr 6;287(15):11924-33. doi: 10.1074/jbc.M111.322792. Epub 2012 Feb 13. J Biol Chem. 2012. PMID: 22334708 Free PMC article.
-
[Noncanonical NF-κB pathway and hematological malignancies].Zhongguo Shi Yan Xue Ye Xue Za Zhi. 2010 Aug;18(4):1069-73. Zhongguo Shi Yan Xue Ye Xue Za Zhi. 2010. PMID: 20723331 Review. Chinese.
-
Unexpected functions of nuclear factor-κB during germinal center B-cell development: implications for lymphomagenesis.Curr Opin Hematol. 2015 Jul;22(4):379-87. doi: 10.1097/MOH.0000000000000160. Curr Opin Hematol. 2015. PMID: 26049760 Free PMC article. Review.
Cited by
-
Molecular stripping, targets and decoys as modulators of oscillations in the NF-κB/IκBα/DNA genetic network.J R Soc Interface. 2016 Sep;13(122):20160606. doi: 10.1098/rsif.2016.0606. Epub 2016 Sep 28. J R Soc Interface. 2016. PMID: 27683001 Free PMC article.
-
Single-cell RNA sequencing of a European and an African lymphoblastoid cell line.Sci Data. 2019 Jul 4;6(1):112. doi: 10.1038/s41597-019-0116-4. Sci Data. 2019. PMID: 31273215 Free PMC article.
-
NF-κB-Dependent Lymphoid Enhancer Co-option Promotes Renal Carcinoma Metastasis.Cancer Discov. 2018 Jul;8(7):850-865. doi: 10.1158/2159-8290.CD-17-1211. Epub 2018 Jun 6. Cancer Discov. 2018. PMID: 29875134 Free PMC article.
-
Deletion of metal transporter Zip14 (Slc39a14) produces skeletal muscle wasting, endotoxemia, Mef2c activation and induction of miR-675 and Hspb7.Sci Rep. 2020 Mar 4;10(1):4050. doi: 10.1038/s41598-020-61059-2. Sci Rep. 2020. PMID: 32132660 Free PMC article.
-
Impairment of Mature B Cell Maintenance upon Combined Deletion of the Alternative NF-κB Transcription Factors RELB and NF-κB2 in B Cells.J Immunol. 2016 Mar 15;196(6):2591-601. doi: 10.4049/jimmunol.1501120. Epub 2016 Feb 5. J Immunol. 2016. PMID: 26851215 Free PMC article.
References
-
- Baek SH, Ohgi KA, Rose DW, Koo EH, Glass CK, Rosenfeld MG. Exchange of N-CoR corepressor and Tip60 coactivator complexes links gene expression by NF-kappaB and beta-amyloid precursor protein. Cell. 2002;110:55–67. - PubMed
-
- Ben-Neriah Y, Karin M. Inflammation meets cancer, with NF-kappaB as the matchmaker. Nat Immunol. 2011;12:715–723. - PubMed
-
- Bonizzi G, Karin M. The two NF-kappaB activation pathways and their role in innate and adaptive immunity. Trends Immunol. 2004;25:280–288. - PubMed
Publication types
MeSH terms
Substances
Associated data
- Actions
Grants and funding
LinkOut - more resources
Full Text Sources
Other Literature Sources
Molecular Biology Databases
Research Materials
Miscellaneous

