SIRT3 deacetylates and increases pyruvate dehydrogenase activity in cancer cells
- PMID: 25152236
- PMCID: PMC4364304
- DOI: 10.1016/j.freeradbiomed.2014.08.001
SIRT3 deacetylates and increases pyruvate dehydrogenase activity in cancer cells
Abstract
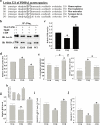
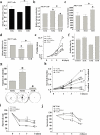
Pyruvate dehydrogenase E1α (PDHA1) is the first component enzyme of the pyruvate dehydrogenase (PDH) complex that transforms pyruvate, via pyruvate decarboxylation, into acetyl-CoA that is subsequently used by both the citric acid cycle and oxidative phosphorylation to generate ATP. As such, PDH links glycolysis and oxidative phosphorylation in normal as well as cancer cells. Herein we report that SIRT3 interacts with PDHA1 and directs its enzymatic activity via changes in protein acetylation. SIRT3 deacetylates PDHA1 lysine 321 (K321), and a PDHA1 mutant mimicking a deacetylated lysine (PDHA1(K321R)) increases PDH activity, compared to the K321 acetylation mimic (PDHA1(K321Q)) or wild-type PDHA1. Finally, PDHA1(K321Q) exhibited a more transformed in vitro cellular phenotype compared to PDHA1(K321R). These results suggest that the acetylation of PDHA1 provides another layer of enzymatic regulation, in addition to phosphorylation, involving a reversible acetyllysine, suggesting that the acetylome, as well as the kinome, links glycolysis to respiration.
Keywords: Acetylation; Carcinogenesis; Free radicals; PDHA1; Pyruvate dehydrogenase; SIRT3; Warburg.
Copyright © 2014 Elsevier Inc. All rights reserved.
Figures


Similar articles
-
Tyr phosphorylation of PDP1 toggles recruitment between ACAT1 and SIRT3 to regulate the pyruvate dehydrogenase complex.Mol Cell. 2014 Feb 20;53(4):534-48. doi: 10.1016/j.molcel.2013.12.026. Epub 2014 Jan 30. Mol Cell. 2014. PMID: 24486017 Free PMC article.
-
Tyr-301 phosphorylation inhibits pyruvate dehydrogenase by blocking substrate binding and promotes the Warburg effect.J Biol Chem. 2014 Sep 19;289(38):26533-26541. doi: 10.1074/jbc.M114.593970. Epub 2014 Aug 7. J Biol Chem. 2014. PMID: 25104357 Free PMC article.
-
SIRT3 (Sirtuin-3) Prevents Ang II (Angiotensin II)-Induced Macrophage Metabolic Switch Improving Perivascular Adipose Tissue Function.Arterioscler Thromb Vasc Biol. 2021 Feb;41(2):714-730. doi: 10.1161/ATVBAHA.120.315337. Epub 2020 Dec 17. Arterioscler Thromb Vasc Biol. 2021. PMID: 33327751
-
Pyruvate dehydrogenase complex deficiency and its relationship with epilepsy frequency--An overview.Epilepsy Res. 2015 Oct;116:40-52. doi: 10.1016/j.eplepsyres.2015.07.002. Epub 2015 Jul 8. Epilepsy Res. 2015. PMID: 26354166 Review.
-
The Warburg effect in tumor progression: mitochondrial oxidative metabolism as an anti-metastasis mechanism.Cancer Lett. 2015 Jan 28;356(2 Pt A):156-64. doi: 10.1016/j.canlet.2014.04.001. Epub 2014 Apr 13. Cancer Lett. 2015. PMID: 24732809 Free PMC article. Review.
Cited by
-
Sirtuins and the Metabolic Hurdles in Cancer.Curr Biol. 2015 Jun 29;25(13):R569-83. doi: 10.1016/j.cub.2015.05.012. Curr Biol. 2015. PMID: 26126285 Free PMC article. Review.
-
The Importance of Mitochondrial Pyruvate Carrier in Cancer Cell Metabolism and Tumorigenesis.Cancers (Basel). 2021 Mar 24;13(7):1488. doi: 10.3390/cancers13071488. Cancers (Basel). 2021. PMID: 33804985 Free PMC article. Review.
-
The mitochondrial multi-omic response to exercise training across tissues.bioRxiv [Preprint]. 2023 Jan 13:2023.01.13.523698. doi: 10.1101/2023.01.13.523698. bioRxiv. 2023. Update in: Cell Metab. 2024 Jun 4;36(6):1411-1429.e10. doi: 10.1016/j.cmet.2023.12.021 PMID: 36711881 Free PMC article. Updated. Preprint.
-
Subcellular compartmentalization of NAD+ and its role in cancer: A sereNADe of metabolic melodies.Pharmacol Ther. 2019 Aug;200:27-41. doi: 10.1016/j.pharmthera.2019.04.002. Epub 2019 Apr 8. Pharmacol Ther. 2019. PMID: 30974124 Free PMC article. Review.
-
Pyruvate dehydrogenase E1α represents a reliable prognostic predictor for patients with non-small cell lung cancer resected via curative operation.J Thorac Dis. 2021 Oct;13(10):5691-5700. doi: 10.21037/jtd-21-1463. J Thorac Dis. 2021. PMID: 34795919 Free PMC article.
References
-
- Peters SJ. Regulation of PDH activity and isoform expression: diet and exercise. Biochem Soc Trans. 2003;31:1274–1280. - PubMed
-
- Pilegaard H, Birk JB, Sacchetti M, Mourtzakis M, Hardie DG, et al. PDH-E1alpha dephosphorylation and activation in human skeletal muscle during exercise: effect of intralipid infusion. Diabetes. 2006;55:3020–3027. - PubMed
-
- Knoechel TR, Tucker AD, Robinson CM, Phillips C, Taylor W, et al. Regulatory roles of the N-terminal domain based on crystal structures of human pyruvate dehydrogenase kinase 2 containing physiological and synthetic ligands. Biochemistry. 2006;45:402–415. - PubMed
Publication types
MeSH terms
Substances
Grants and funding
- R01 GM073929/GM/NIGMS NIH HHS/United States
- P30 CA086862/CA/NCI NIH HHS/United States
- R01 CA169046/CA/NCI NIH HHS/United States
- R01 CA152799/CA/NCI NIH HHS/United States
- 1R01CA152601-01/CA/NCI NIH HHS/United States
- 1R01CA16383801A1/CA/NCI NIH HHS/United States
- R01 CA152601/CA/NCI NIH HHS/United States
- R01 CA163838/CA/NCI NIH HHS/United States
- R01 CA168292/CA/NCI NIH HHS/United States
- DP2 OD007483/OD/NIH HHS/United States
- P30 ES005605/ES/NIEHS NIH HHS/United States
- P30 CA060553/CA/NCI NIH HHS/United States
- 1R01CA168292-01A1/CA/NCI NIH HHS/United States
- 1R01CA152799-01A1/CA/NCI NIH HHS/United States
- R01CA169046/CA/NCI NIH HHS/United States
LinkOut - more resources
Full Text Sources
Other Literature Sources
Research Materials

