Alpha-lipoic acid attenuates insulin resistance and improves glucose metabolism in high fat diet-fed mice
- PMID: 25152027
- PMCID: PMC4186984
- DOI: 10.1038/aps.2014.64
Alpha-lipoic acid attenuates insulin resistance and improves glucose metabolism in high fat diet-fed mice
Abstract
Aim: To investigate whether alpha-lipoic acid (ALA) could attenuate the insulin resistance and metabolic disorders in high fat diet-fed mice.
Methods: Male mice were fed a high fat diet (HFD) plus ALA (100 and 200 mg·kg(-1)·d(-1)) or HFD plus a positive control drug metformin (300 mg·kg(-1)·d(-1)) for 24 weeks. During the treatments, the relevant physiological and metabolic parameters of the mice were measured. After the mice were euthanized, blood samples and livers were collected. The expression of proteins and genes related to glucose metabolism in livers were analyzed by immunoblotting and real time-PCR.
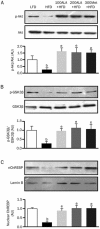
Results: HFD induced non-alcoholic fatty liver disease (NAFLD) and abnormal physiological and metabolic parameters in the mice, which were dose-dependently attenuated by ALA. ALA also significantly reduced HFD-induced hyperglycemia and insulin resistance in HFD-fed mice. Furthermore, ALA significantly upregulated the glycolytic enzymes GCK, HK-1 and PK, and the glycogen synthesis enzyme GS, and downregulated the gluconeogenic enzymes PEPCK and G6Pase, thus decreased glucose production, and promoted glycogen synthesis and glucose utilization in livers. Moreover, ALA markedly increased PKB/Akt and GSK3β phosphorylation, and nuclear carbohydrate response element binding protein (ChREBP) expression in livers. Metformin produced similar effects as ALA in HFD-fed mice.
Conclusion: ALA is able to sustain glucose homeostasis and prevent the development of NAFLD in HFD-fed mice.
Figures


Similar articles
-
Yangonin protects against non-alcoholic fatty liver disease through farnesoid X receptor.Phytomedicine. 2019 Feb;53:134-142. doi: 10.1016/j.phymed.2018.09.006. Epub 2018 Sep 5. Phytomedicine. 2019. PMID: 30668392
-
Ugonin J improves metabolic disorder and ameliorates nonalcoholic fatty liver disease by regulating the AMPK/AKT signaling pathway.Pharmacol Res. 2021 Jan;163:105298. doi: 10.1016/j.phrs.2020.105298. Epub 2020 Nov 18. Pharmacol Res. 2021. PMID: 33220422
-
Effects of octreotide on hepatic glycogenesis in rats with high fat diet‑induced obesity.Mol Med Rep. 2017 Jul;16(1):109-118. doi: 10.3892/mmr.2017.6586. Epub 2017 May 16. Mol Med Rep. 2017. PMID: 28534956 Free PMC article.
-
Irisin inhibits hepatic gluconeogenesis and increases glycogen synthesis via the PI3K/Akt pathway in type 2 diabetic mice and hepatocytes.Clin Sci (Lond). 2015 Nov;129(10):839-50. doi: 10.1042/CS20150009. Epub 2015 Jul 13. Clin Sci (Lond). 2015. PMID: 26201094
-
Whole grains-derived functional ingredients against hyperglycemia: targeting hepatic glucose metabolism.Crit Rev Food Sci Nutr. 2024;64(20):7268-7289. doi: 10.1080/10408398.2023.2183382. Epub 2023 Feb 27. Crit Rev Food Sci Nutr. 2024. PMID: 36847153 Review.
Cited by
-
Biliverdin Reductase A Attenuates Hepatic Steatosis by Inhibition of Glycogen Synthase Kinase (GSK) 3β Phosphorylation of Serine 73 of Peroxisome Proliferator-activated Receptor (PPAR) α.J Biol Chem. 2016 Nov 25;291(48):25179-25191. doi: 10.1074/jbc.M116.731703. Epub 2016 Oct 10. J Biol Chem. 2016. PMID: 27738106 Free PMC article.
-
α-Lipoic Acid Maintains Brain Glucose Metabolism via BDNF/TrkB/HIF-1α Signaling Pathway in P301S Mice.Front Aging Neurosci. 2020 Aug 21;12:262. doi: 10.3389/fnagi.2020.00262. eCollection 2020. Front Aging Neurosci. 2020. PMID: 32973490 Free PMC article.
-
Optimal fasting duration for mice as assessed by metabolic status.Sci Rep. 2024 Sep 14;14(1):21509. doi: 10.1038/s41598-024-72695-3. Sci Rep. 2024. PMID: 39277628 Free PMC article.
-
Therapeutic Effects of Heterotrigona itama (Stingless Bee) Bee Bread in Improving Hepatic Lipid Metabolism through theActivation of the Keap1/Nrf2 Signaling Pathway in an Obese Rat Model.Antioxidants (Basel). 2022 Nov 5;11(11):2190. doi: 10.3390/antiox11112190. Antioxidants (Basel). 2022. PMID: 36358563 Free PMC article.
-
Effects of Simultaneous Exposure to a Western Diet and Wheel-Running Training on Brain Energy Metabolism in Female Rats.Nutrients. 2021 Nov 26;13(12):4242. doi: 10.3390/nu13124242. Nutrients. 2021. PMID: 34959794 Free PMC article.
References
Publication types
MeSH terms
Substances
LinkOut - more resources
Full Text Sources
Other Literature Sources
Miscellaneous

