. 2014 Aug 21:5:4638.
doi: 10.1038/ncomms5638.

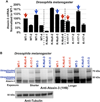
Ubiquitin-binding site 2 of ataxin-3 prevents its proteasomal degradation by interacting with Rad23

Affiliations

Ubiquitin-binding site 2 of ataxin-3 prevents its proteasomal degradation by interacting with Rad23

Jessica R Blount et al. Nat Commun. .

Abstract

Polyglutamine repeat expansion in ataxin-3 causes neurodegeneration in the most common dominant ataxia, spinocerebellar ataxia type 3 (SCA3). Since reducing levels of disease proteins improves pathology in animals, we investigated how ataxin-3 is degraded. Here we show that, unlike most proteins, ataxin-3 turnover does not require its ubiquitination, but is regulated by ubiquitin-binding site 2 (UbS2) on its N terminus. Mutating UbS2 decreases ataxin-3 protein levels in cultured mammalian cells and in Drosophila melanogaster by increasing its proteasomal turnover. Ataxin-3 interacts with the proteasome-associated proteins Rad23A/B through UbS2. Knockdown of Rad23 in cultured cells and in Drosophila results in lower levels of ataxin-3 protein. Importantly, reducing Rad23 suppresses ataxin-3-dependent degeneration in flies. We present a mechanism for ubiquitination-independent degradation that is impeded by protein interactions with proteasome-associated factors. We conclude that UbS2 is a potential target through which to enhance ataxin-3 degradation for SCA3 therapy.


Conflict of interest statement

CONFLICT OF INTEREST

The authors declare that they have no conflict of interest.

Figures

Figure 1
Figure 1. Cellular degradation of ataxin-3 does not require its own ubiquitination
A) Schematic of ataxin-3. The catalytic triad (red) and two ubiquitin-binding sites (UbS1, light blue and UbS2, orange) are on the catalytic domain (blue). Next are three ubiquitin-interacting motifs (UIMs; red), separated by the polyglutamine (polyQ) region. Preceding the polyQ is the VCP-binding site (green). The NMR-based structure of the catalytic domain of ataxin-3 was reported in ref. [22]. The file for the structure depicted here was obtained from NCBI (PDB: 1YZB) and was rendered and annotated using the software application MacPyMOL. Legend: abbreviations used in this report. B) Western blot of whole cell lysates. HeLa cells were transfected with the indicated constructs and treated with MG132 (6 hours, 15µM) 24 hours post transfection to enhance the capture of ataxin-3 ubiquitination, as we have described before, . We previously showed through stringent immunopurification protocols and mass spectrometry that the more slowly migrating band of ataxin-3 is ubiquitinated ataxin-3, , , , . Equal total protein loaded (50µg/lane). Transfections were performed independently in triplicate. Overexposed blot to highlight ubiquitinated ataxin-3. C) Top: Western blots of whole cell lysates. HeLa cells were transfected as indicated and treated for the specified amounts of time with cycloheximide (CHX) 48 hours post-transfection. Bottom: Means of ataxin-3 signal quantified from blots on the top and other similar experiments. P values are from Student T-tests comparing protein levels of K-Null ataxin-3 to the wild type counterpart. Error bars: standard deviations. N=6 independently conducted experiments. D) Top: Western blots of whole cell lysates of HeLa cells transfected as indicated, treated or not for 2 hours with the proteasome inhibitor MG132 (10µM) 24 hours after transfection, then treated for the specified amounts of time with cycloheximide (CHX). Bottom: Means of ataxin-3 signal quantified from western blots on the top and other similar, independent experiments. P values are from Student T-tests comparing protein levels of K-Null ataxin-3 to the normal version of the protein. Error bars: standard deviations. N=6 independently conducted experiments.
Figure 2
Figure 2. Lysine-less ataxin-3 does not accumulate in vivo in Drosophila
A) Selection of transgenic fly lines that express similar levels of ataxin-3 variants. Quantitative RT-PCR results from whole flies expressing the versions of UAS-ataxin-3 noted in the panel. At least 5 flies were used per genotype per experiment. Driver was sqh-Gal4 (ubiquitous expression, ). All flies were heterozygous for UAS-ataxin-3 and sqh-Gal4 transgenes. Red and blue arrows: lines that we chose for western blotting shown in panel B. Experiment performed independently in triplicate. Shown are mean ataxin-3 mRNA levels normalized to WT-1. Error bars: standard deviations. Flies were 1–3 days old. B) Western blots from whole fly lysates expressing the indicated UAS-ataxin-3 constructs based on qRT-PCR data from panel A. Driver was sqh-Gal4. All flies were heterozygous for UAS-ataxin-3 and sqh-Gal4 transgenes, as in panel A. Ten or more flies per genotype were homogenized. Blots are representative of experiment performed independently in triplicate, with similar results. Flies were 1–3 days old.
Figure 3
Figure 3. UbS2 of ataxin-3 regulates its degradation in cells
A) Top: Western blots of whole cell lysates. HeLa cells were transfected as indicated and harvested 24 hours later. Bottom: Means of ataxin-3 signal quantified from blots on the top and other similar experiments. Error bars: standard deviations. B) qRT-PCR of HeLa cells expressing the indicated constructs. Endogenous control: GAPDH. N=3 independently conducted experiments. Shown are mean ataxin-3 mRNA levels −/+ standard deviations. C, D) Top: Western blots of whole cell lysates of HeLa cells transfected as indicated, treated or not with MG132 (4 hours, 15µM) 48 hours later and harvested. Bottom: Means of ataxin-3 signal quantified from blots on the top and other similar experiments. Error bars: standard deviations. E, F) Top: HeLa cells were transfected as indicated and 24 hours later were treated with CHX for the specified amounts of time. For panel E, to have comparable protein amounts of both ataxin-3 versions at time 0 min, we transfected 3× more K-Null(UbS2*) construct than K-Null, which was supplemented with empty vector to equate total DNA per group. Western blots of whole cell lysates. Bottom: Means of ataxin-3 signal quantified from blots on the top and other independent experiments. Error bars: standard deviations. G) Top: Western blots of whole cell lysates. Two different mutations were used to disrupt UbS2: W87A and W87K, with similar results. Bottom: Means of ataxin-3 signal quantified from blots on the top and other independent experiments. Error bars: standard deviations. H) Top: HeLa cells were transfected as indicated and 24 hours later were treated with CHX for the specified time points. 3× more ataxin-3(UbS2*) construct was transfected than ataxin-3(WT) to have comparable protein levels at time 0 min. Bottom: Means of ataxin-3 signal quantified from blots on the top and other independent experiments. Error bars: standard deviations. For panels A, B, C, D and G, P values are from ANOVA with Tukey post-hoc correction comparing the various versions of ataxin-3 to their panel controls. For panels E, F and H, P values are from Student t-tests. N of independently repeated experiments is specified in panels.
Figure 4
Figure 4. UIMs of ataxin-3 oppose the effect of UbS2 mutation
A) Top: HeLa cells were transfected as indicated and harvested 48 hours later. Western blots from whole cell lysates. Bottom: Means of ataxin-3 signal quantified from blots on the top and other similar experiments. P values are from ANOVA with Tukey post-hoc correction comparing K-Null ataxin-3 with UbS2 mutated and K-Null ataxin-3 with UbS2 and UIMs mutated to K-Null ataxin-3 with intact domains. Error bars: standard deviations. N=10 independently conducted experiments. B) Top: HeLa cells were transfected with the indicated constructs. 3× more UbS2* DNA was used than UbS2*-UIM* to begin with approximately the same amount of protein at time 0h. CHX was added to cells 24 hours post transfection for the specified time points. Western blots of whole cell lysates. Bottom: Means of ataxin-3 signal quantified from blots on the top and other similar experiments. P values are from Student T-tests comparing ataxin-3 with UbS2 mutated to ataxin-3 with UbS2 and UIMs mutated. Error bars: standard deviations. N=6 independently conducted experiments. C) Top: HeLa cells were transfected with the indicated siRNA constructs to knock down endogenous Rad23A, endogenous Rad23B or both, and harvested 48 hours later. Shown are western blots of whole cell lysates. siRNA control: scramble controls. Bottom: Means of ataxin-3 signal quantified from blots on the top and other similar experiments. P values of less than 0.01 are indicated by “**”, and are from ANOVA/Tukey comparing the levels of ataxin-3 protein in RNAi lanes to those in scramble control. Error bars: standard deviations. N=7 independently conducted experiments.
Figure 5
Figure 5. UbS2 mutation leads to reduced ataxin-3 protein levels in Drosophila
A) Quantitative RT-PCR results from whole flies expressing the noted versions of UAS-ataxin-3 driven by sqh-Gal4. All flies were heterozygous for UAS-ataxin-3 and sqh-Gal4 transgenes. Red arrows: WT and UbS2* lines that have comparable ataxin-3 mRNA levels. Blue arrows: UbS2* lines that have markedly higher ataxin-3 mRNA levels than WT versions. Experiment performed independently in triplicate, utilizing at least 5 flies per genotype per experiment. Shown are mean ataxin-3 mRNA levels normalized to WT-1. Error bars: standard deviations. B) Left: Western blots from whole flies based on qRT-PCR results from panel A. At least 5 flies were homogenized per genotype. Driver was sqh-Gal4. All flies were heterozygous for UAS-ataxin-3 and sqh-Gal4 transgenes, as in panel A. Note that for this blot 1.5× more lysate was loaded for the line that expresses UbS2*-2 to enable visualization of ataxin-3 protein in this line by western blotting without saturating the signal from other lysates. Right: Means of ataxin-3 signal quantified from blots on the left and other independent experiments. P values are from Student T-test (WT-3 and UbS2*-2) and ANOVA/Tukey (the other lines). Error bars: standard deviations. N=3 independently conducted experiments. Flies were 1–3 days old.
Figure 6
Figure 6. Turnover of pathogenic ataxin-3 protein is also regulated by UbS2
A, C) Left: Western blots from HeLa cells transfected as indicated and treated or not with MG132 (4 hours, 15µM) 24 hours after transfection. Right: Means of ataxin-3 signal quantified from blots on the left and other similar experiments. P values are from Student T-tests. Error bars: standard deviations. N of independently conducted experiments is provided in the respective panels. B) Left: Western blots of HeLa cells transfected as indicated and treated with CHX 24 hours later. Right: Means of ataxin-3 signal quantified from blots on the left and other similar experiments. P values are from Student T-tests. Error bars: standard deviations. N=7 independently conducted experiments. D) Left: Western blots from at least 10 dissected fly heads for each indicated group. Right: Means of ataxin-3 signal quantified from blots on the left and other similar experiments. P values are from Student T-tests. Error bars: standard deviations. N=8 independent experiments. Flies were 1–2 days old. All flies were heterozygous for UAS-ataxin-3, UAS-Rad23-RNAi (where indicated), and the gmr-Gal4 driver. E) External photos and internal sections of fly eyes expressing UAS-ataxin-3(SCA3) in the isogenic background of the UAS-RNAi line targeting Rad23 (2nd column), with UAS-RNAi targeting Rad23 (third column), in the isogenic background of Rad23 deficiency (4th column, which is the control for column 5; see main text for description), or in the presence of one copy of Rad23 (deficiency line; 5th column). Driver: gmr-Gal4. Double headed arrows: ommatidial boundaries. Boxes: proteinaceous inclusions that contain ataxin-3(SCA3). Control in 1st column contained only gmr-Gal4. The other lines were heterozygous for the gmr-Gal4 driver and UAS-transgenes. Images are representative of sections from at least six flies per group and experiments were conducted independently in triplicate with similar results. Flies were 14 days old. Scale bars in histological sections: 50µM.
Figure 7
Figure 7. Proposed model of ataxin-3 degradation
According to this model, ataxin-3 comes into physical contact with the proteasome by binding to ubiquitinated proteins through its UIMs in the C-terminal portion. Once at the proteasome, in the absence of interaction with Rad23A/B through UbS2, ataxin-3 is degraded by the proteasome. If UbS2 interacts with Rad23A/B, ataxin-3 is rescued from degradation, perhaps as a result of higher affinity for Rad23A/B compared to the proteasome.

Similar articles

Cited by

References

    1. Costa Mdo C, Paulson HL. Toward understanding Machado-Joseph disease. Prog. Neurobiol. 2012;97:239–257. - PMC - PubMed
    1. Todi SV, Williams A, Paulson HL. Polyglutamine Repeat Disorders, including Huntington’s Disease. In: Waxman SG, editor. Molecular Neurology. 1st edition. Academic Press; 2007.
    1. Williams AJ, Paulson HL. Polyglutamine neurodegeneration: protein misfolding revisited. Trends Neurosci. 2008;31:521–528. - PMC - PubMed
    1. Orr HT, Zoghbi HY. Trinucleotide repeat disorders. Ann. Rev. Neurosci. 2007;30:575–621. - PubMed
    1. Reina CP, Zhong X, Pittman RN. Proteotoxic stress increases nuclear localization of ataxin-3. Hum. Mol. Genet. 2010;19:235–249. - PMC - PubMed

Publication types

MeSH terms

LinkOut - more resources