. 2014 Sep 2;111(35):E3669-78.
doi: 10.1073/pnas.1405798111. Epub 2014 Aug 18.

Mannan induces ROS-regulated, IL-17A-dependent psoriasis arthritis-like disease in mice

Affiliations

Mannan induces ROS-regulated, IL-17A-dependent psoriasis arthritis-like disease in mice

Ia Khmaladze et al. Proc Natl Acad Sci U S A. .

Abstract

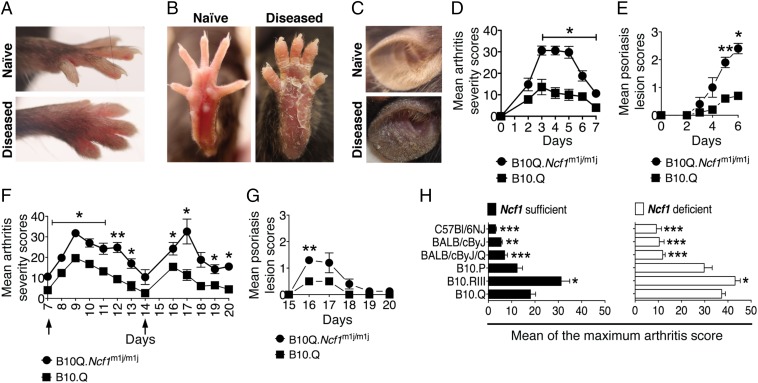
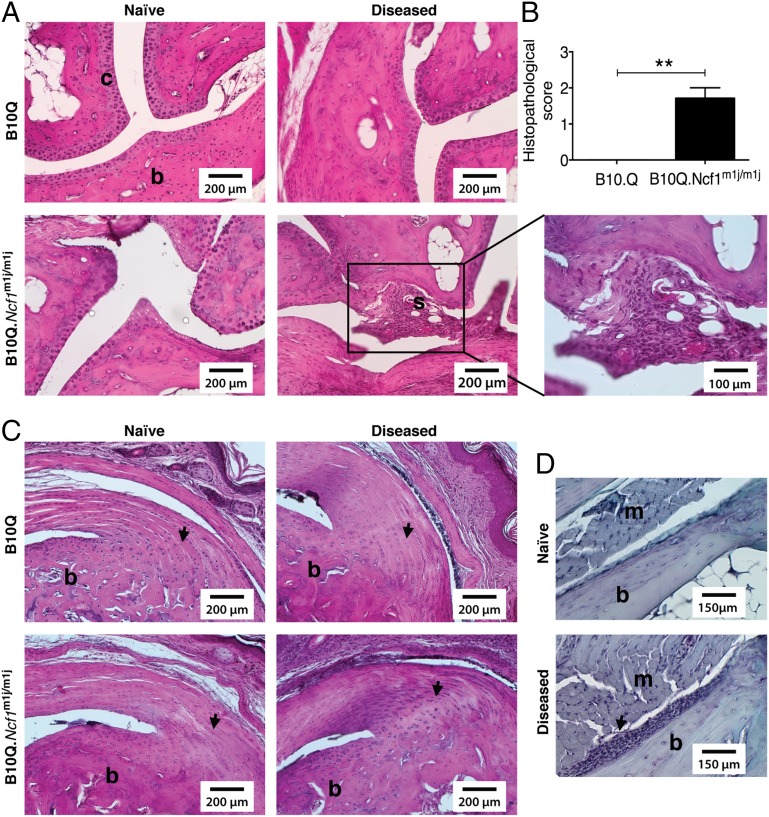
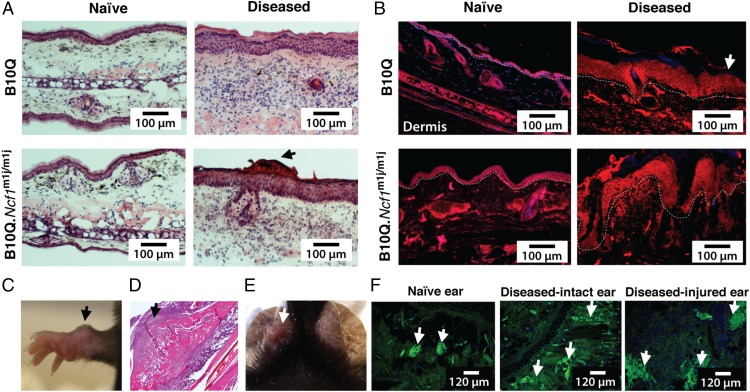
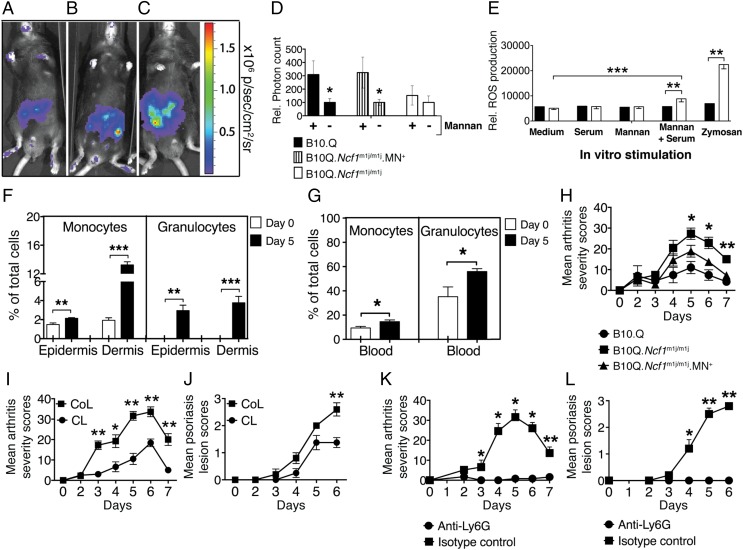
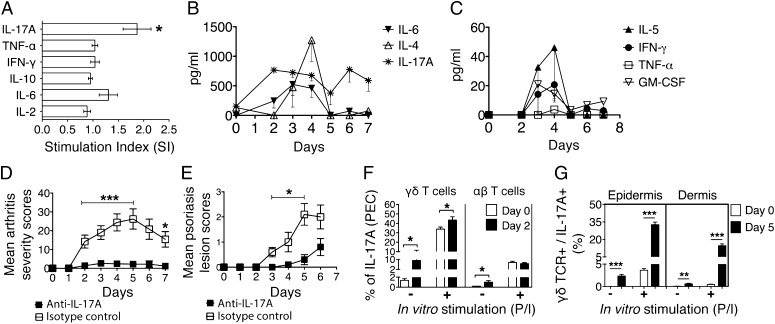
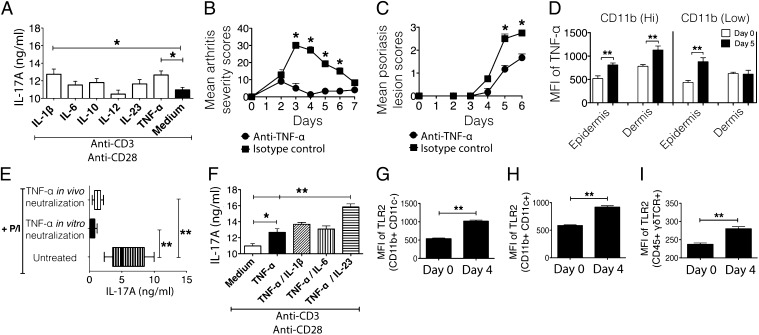
Psoriasis (Ps) and psoriasis arthritis (PsA) are poorly understood common diseases, induced by unknown environmental factors, affecting skin and articular joints. A single i.p. exposure to mannan from Saccharomyces cerevisiae induced an acute inflammation in inbred mouse strains resembling human Ps and PsA-like disease, whereas multiple injections induced a relapsing disease. Exacerbation of disease severity was observed in mice deficient for generation of reactive oxygen species (ROS). Interestingly, restoration of ROS production, specifically in macrophages, ameliorated both skin and joint disease. Neutralization of IL-17A, mainly produced by γδ T cells, completely blocked disease symptoms. Furthermore, mice depleted of granulocytes were resistant to disease development. In contrast, certain acute inflammatory mediators (C5, Fcγ receptor III, mast cells, and histamine) and adaptive immune players (αβ T and B cells) were redundant in disease induction. Hence, we propose that mannan-induced activation of macrophages leads to TNF-α secretion and stimulation of local γδ T cells secreting IL-17A. The combined action of activated macrophages and IL-17A produced in situ drives neutrophil infiltration in the epidermis and dermis of the skin, leading to disease manifestations. Thus, our finding suggests a new mechanism triggered by exposure to exogenous microbial components, such as mannan, that can induce and exacerbate Ps and PsA.

Keywords: Ncf1; animal model; autoimmune disease.


Conflict of interest statement

The authors declare no conflict of interest.

Figures

Fig. 1.
Fig. 1.
ROS deficiency enhanced mannan-induced PsA. The arthritic joint phenotype and Ps-like skin lesions in the front (A) and hind (B) paws of B10Q.Ncf1m1j/m1j mice are shown. (C) Ps-like skin scaling in diseased B10Q.Ncf1m1j/m1j mouse ear compared with naive mouse ear. Mean arthritis (D) and Ps lesion (E) severity in B10Q (n = 5) and B10Q.Ncf1m1j/m1j (n = 5) mice after a single i.p. mannan injection. Mean arthritis (F) and Ps lesion (G) severity in B10Q (n = 5) and B10Q.Ncf1m1j/m1j (n = 5) mice after repetitive mannan injections (days 7 and 14). (H) Mannan-induced mean maximum arthritis scores ± SEM in different mouse strains: B10Q (n = 8), B10Q.Ncf1m1j/m1j (n = 9), B10RIII (n = 10), B10RIII.Ncf1m1j/m1j (n = 9), B10P (n = 3), B10P.Ncf1m1j/m1j (n = 9), BALB/cByJ/Q (n = 10), BALB/cByJ/Q.Ncf1m1j/m1j (n = 8), BALB/cByJ (n = 5), BALB/cByJ.Ncf1m1j/m1j (n = 7), C57BL/6NJ (n = 8), and C57BL/6NJ.Ncf1m1j/m1j (n = 7). Significance was calculated by comparing the maximal disease severity of B10Q and B10Q.Ncf1m1j/m1j mice with all of the other strains in their respective groups. *P < 0.05; **P < 0.01; ***P < 0.001.
Fig. 2.
Fig. 2.
Histology of mannan-induced articular phenotypes. (A) Representative H&E staining of ankle joints of naive/arthritic B10Q (n = 3–5) and B10Q.Ncf1m1j/m1j (n = 3–5) mice after disease initiation (day 4). Microscopic arthritis was absent in diseased B10Q mice, but B10Q.Ncf1m1j/m1j mice had synovial infiltrates (shown as “s”) with mild cartilage damage. (Scale bars: 200 μm. Magnification: 100 μm.) (B) Mean histopathological scores of disease-affected B10Q (n = 5) and B10Q.Ncf1m1j/m1j (n = 7) mouse joints. Data is presented as mean ± SEM. **P < 0.01. (C) Visualization of entheseal inflammation in the Achilles tendon in disease-affected B10Q (n = 5) and B10Q.Ncf1m1j/m1j (n = 7) mice compared with naive mice (arrows). (Scale bars: 200 μm.) (D) Additionally, periostitis was observed in B10Q.Ncf1m1j/m1j mice (n = 7, arrow). (Scale bars: 150 μm.) b, bone; m, muscle; s, synovial membrane.
Fig. 3.
Fig. 3.
Mannan-induced cutaneous phenotypes in mice. (A) H&E staining of ear tissues from naive and diseased B10Q and B10Q.Ncf1m1j/m1j mice after mannan injection (day 4). (Scale bars: 100 μm.) Dermatitis with intraepidermal accumulation of neutrophilic granulocytes and intracorneal pustules was present in the diseased ears of B10Q mice, whereas mild hyperkeratosis and acanthosis, together with focal parakeratosis and intracorneal pustules (arrow), were observed in the inflamed ears of B10Q.Ncf1m1j/m1j mice. Ears from naive mice did not show any signs of inflammation. (B) Involucrin staining (red) showing abnormal keratinocyte differentiation in the hind paw skin sections of mice after disease induction on day 4 (n = 3 mice per group). Naive mouse skin contained a normal distribution of epidermal keratinocytes. DAPI was used for staining nuclei. (Scale bars: 100 μm.) The white dashed line indicates the border between the epidermal and dermal layers of the skin (white arrow points toward epidermis). (C) Representative image of an “osteogenic nodule” formation (arrow) in a female B10Q.Ncf1m1j/m1j mouse on day 11 after mannan injection. (D) H&E staining of an osteogenic nodule illustrates new bone formation (arrow). (Magnification: 10×). (E) Representative image of ear punching (white arrow). (F) Naive, diseased intact, and diseased-injured ear tissues were stained with MECA-79, depicting dilated blood vessels (arrows) on day 5 after mannan injection (green) (n = 3 mice per group). (Scale bars: 120 μm.)
Fig. 4.
Fig. 4.
Contribution of monocytes/macrophages and neutrophils in mannan-induced inflammation. Representative in vivo imaging of ROS with L-012 in B10Q (A), B10Q.Ncf1m1j//m1j.MN+ (B), and B10Q.Ncf1m1j/m1j (C) mice. sr, steradian. (D) ROS production was measured in the hind paws of B10Q, B10Q.Ncf1m1j//m1j.MN+, and B10Q.Ncf1m1j/m1j mice 3 d after mannan injection. Luminescent signal was detected 10 min after L-012 injection. The statistical significance was calculated between naive (designated as −) and mannan-injected (designated as +) mice in all of the experimental groups. Rel., relative. (E) In vitro ROS production was measured in blood granulocytes (CD11b+ Ly6G+) of B10Q.Ncf1m1j/m1j (filled bars) (n = 4) and B10Q (empty bars) (n = 6) mice after 3 h of incubation with stimulants. The total frequency of monocytes/macrophages and granulocytes (flow cytometry gating from single viable cells) in the skin epidermis/dermis (F) and blood (G) of B10Q.Ncf1m1j/m1j mice on day 0 (empty bars) and day 5 after mannan injection (filled bars) is shown (n = 5–7 mice per group). (H) Mean arthritis severity in B10Q.Ncf1m1j/m1j (n = 7), B10Q.Ncf1m1j//m1j. MN+ (n = 8), and B10Q mice (n = 5). The significance of disease severity was calculated between B10Q.Ncf1m1j/m1j and B10Q.Ncf1m1j//m1j.MN+ mice. The mean arthritis (I) and Ps skin lesion (J) severity of B10Q.Ncf1m1j/m1j mice after macrophage depletion using CLs (n = 8 mice/group) is shown. The control group received control liposomes (CoL) only (n = 5 mice per group). The mean arthritis (K) and Ps skin lesion (L) severity in B10Q.Ncf1m1j/m1j mice after neutrophil depletion using anti-Ly6G antibodies is shown. The control group received isotype control antibodies (100 μg per i.v. injection, n = 5 mice per group). All of the data are presented as mean ± SEM. *P < 0.05; **P < 0.01; ***P < 0.001.
Fig. 5.
Fig. 5.
Mannan-induced inflammation is dependent on γδ T cells secreting IL-17A. (A) Stimulation index (SI) (fold change over naive mice) of different cytokines in the peritoneum of B10Q.Ncf1m1j/m1j mice before (day 0) and after (day 5) mannan injection (n =12 mice per group). The kinetics of cytokine synthesis from the naive (day 0) and mannan-injected (days 2–7) mouse ear skin cell culture supernatant were measured by cytometric bead array (CBA). A total of 1 × 10⁶ skin cells were stimulated with PMA/ionomycin and cultured for 4 h at 37 °C in vitro before the assay run (n = 4 mice per time point). (B and C) Cytokine concentration is expressed in picograms per milliliter. Mannan-induced arthritis (D) and Ps lesion (E) severity in B10Q.Ncf1m1j/m1j mice (n = 5 mice per group) treated with anti–IL-17A or isotype control antibody (100 μg per injection). (F) Frequency of PEC-derived IL-17A+ γδ T and IL-17A+ αβ T cells in B10Q.Ncf1m1j/m1j mice before (day 0) and after (day 2) mannan injection (n = 4–8 mice per group). (G) Frequency of IL-17A+ γδ T cells in B10Q.Ncf1m1j/m1j mouse epidermis and dermis before (day 0) and after (day 5) mannan injection (n = 5 mice per group). For in vitro stimulation, PMA/ionomycin (P/I) was used in the culture. All of the data are presented as mean ± SEM. *P < 0.05; **P < 0.01; ***P < 0.001.
Fig. 6.
Fig. 6.
IL-17A production is dependent on monocyte/macrophage-secreted TNF-α. (A) IL-17A levels (nanograms per milliliter) were measured in epidermal cell culture supernatant on day 5 after mannan injection. Different cytokines were used in combination with plate-bound anti-CD3/CD28 for stimulating cells in culture. The total culture time was 72 h at 37 °C. Mean arthritis (B) and Ps lesion (C) severity in B10Q.Ncf1m1j/m1j mice during TNF-α (n = 3–5 mice per group) in vivo neutralization. (D) Mean fluorescence intensity (MFI; geometric mean) of TNF-α expression in epidermal and dermal CD11b (Low) and CD11b (Hi) cells (gated on Ly6G cells) after mannan injection. (E) IL-17A levels (nanograms per milliliter) were measured in mannan-activated skin cell culture supernatants (1 × 10⁶ cells) stimulated with P/I ± TNF-α neutralization in vivo or in vitro for 48 h. (F) IL-17A levels (nanograms per milliliter) were measured in epidermal cell culture supernatant on day 5 after mannan injection. TNF-α alone and in combination with IL-1β, IL-6, and IL-23 was used, together with plate-bound anti-CD3/CD28 for stimulating cells in culture. The total culture time was 72 h at 37 °C. The MFI (geometric mean) of TLR2 in CD11b+ CD11c (G), CD11b+ CD11c+ (H), and CD45+ γδ TCR+ (I) epidermal skin cells before (day 0) and after (day 4) disease induction in B10Q.Ncf1m1j/m1j mice (n = 5 mice per group) is shown. All of the data are presented as mean ± SEM. *P < 0.05; **P < 0.01.

Similar articles

Cited by

References

    1. Nickoloff BJ, Nestle FO. Recent insights into the immunopathogenesis of psoriasis provide new therapeutic opportunities. J Clin Invest. 2004;113(12):1664–1675. - PMC - PubMed
    1. Liu Y, et al. A genome-wide association study of psoriasis and psoriatic arthritis identifies new disease loci. PLoS Genet. 2008;4(3):e1000041. - PMC - PubMed
    1. Tsoi LC, et al. Collaborative Association Study of Psoriasis (CASP) Genetic Analysis of Psoriasis Consortium Psoriasis Association Genetics Extension Wellcome Trust Case Control Consortium 2 Identification of 15 new psoriasis susceptibility loci highlights the role of innate immunity. Nat Genet. 2012;44(12):1341–1348. - PMC - PubMed
    1. Knight J, et al. Wellcome Trust Case Control Consortium Genetic Analysis of Psoriasis Consortium I-chip for Psoriasis Consortium Conditional analysis identifies three novel major histocompatibility complex loci associated with psoriasis. Hum Mol Genet. 2012;21(23):5185–5192. - PMC - PubMed
    1. Gladman DD, Farewell VT. HLA studies in psoriatic arthritis: Current situation and future needs. J Rheumatol. 2003;30(1):4–6. - PubMed

Publication types

MeSH terms