. 2014 Nov;34(21):3981-92.
doi: 10.1128/MCB.00113-14. Epub 2014 Aug 18.

TPC1 has two variant isoforms, and their removal has different effects on endo-lysosomal functions compared to loss of TPC2

Affiliations

TPC1 has two variant isoforms, and their removal has different effects on endo-lysosomal functions compared to loss of TPC2

Margarida Ruas et al. Mol Cell Biol. 2014 Nov.

Abstract

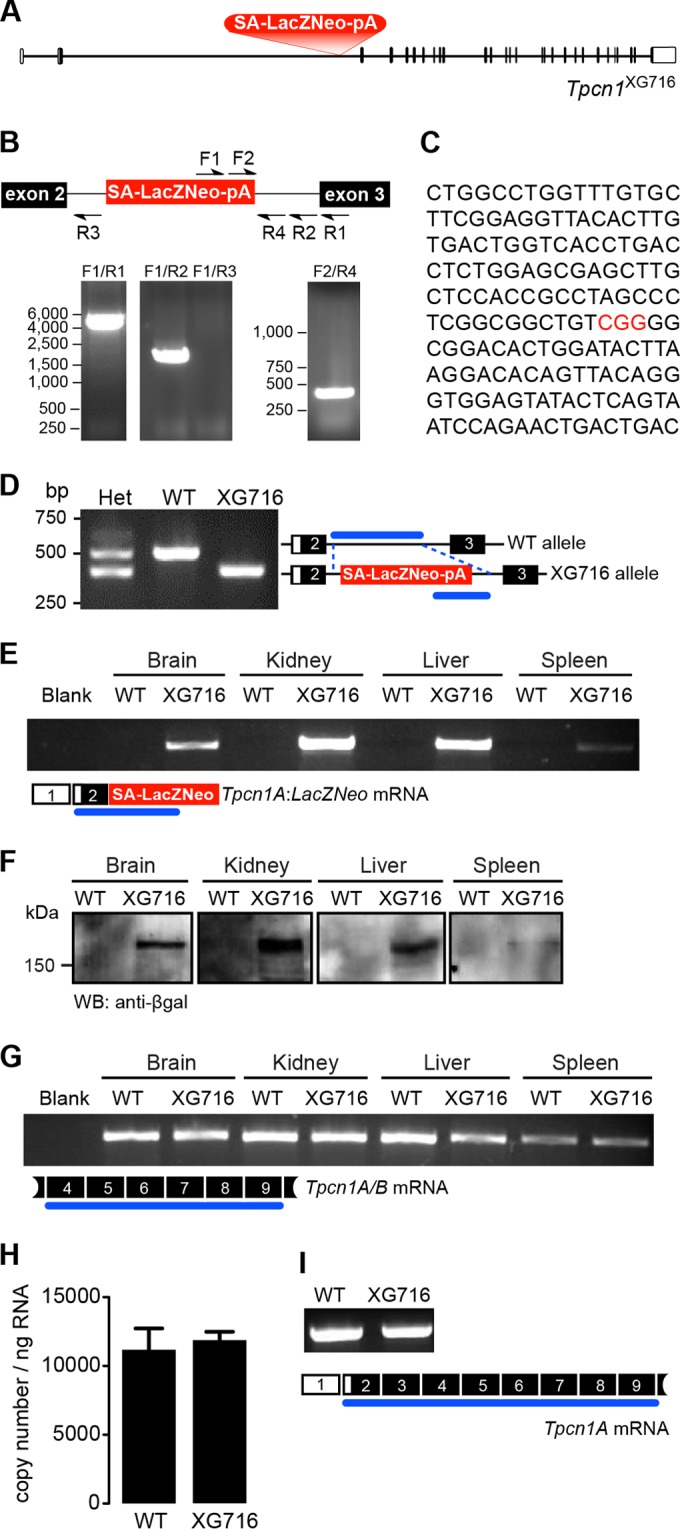
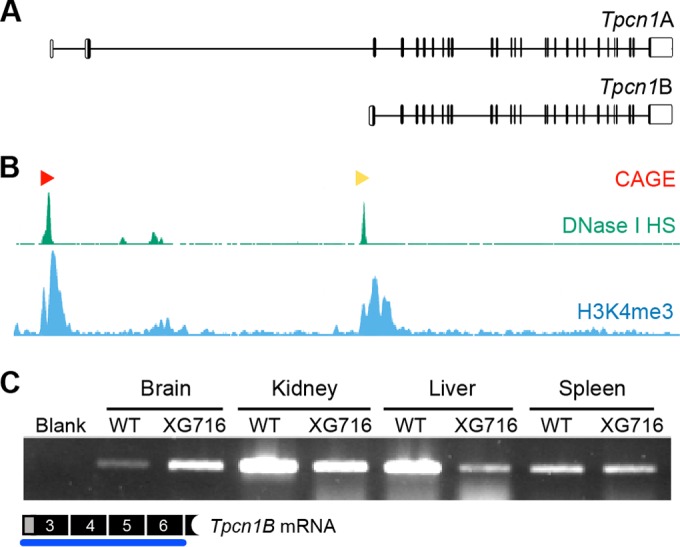
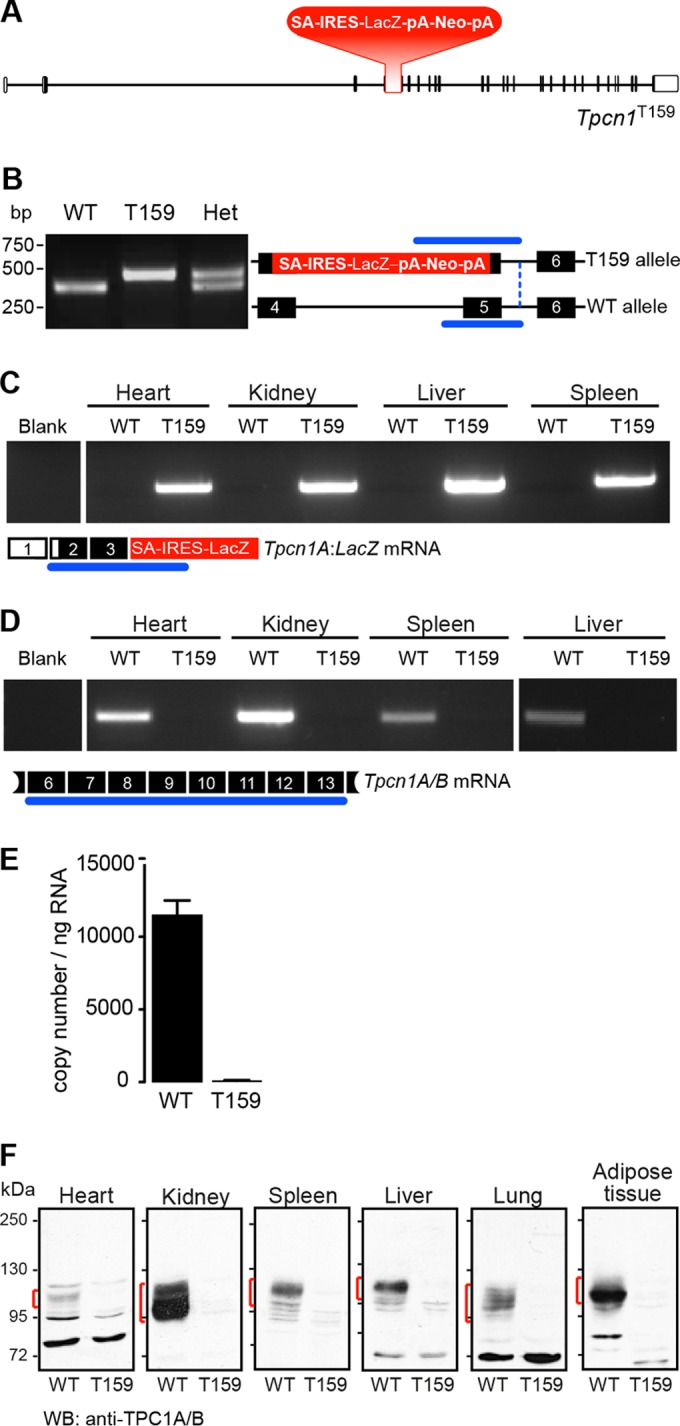
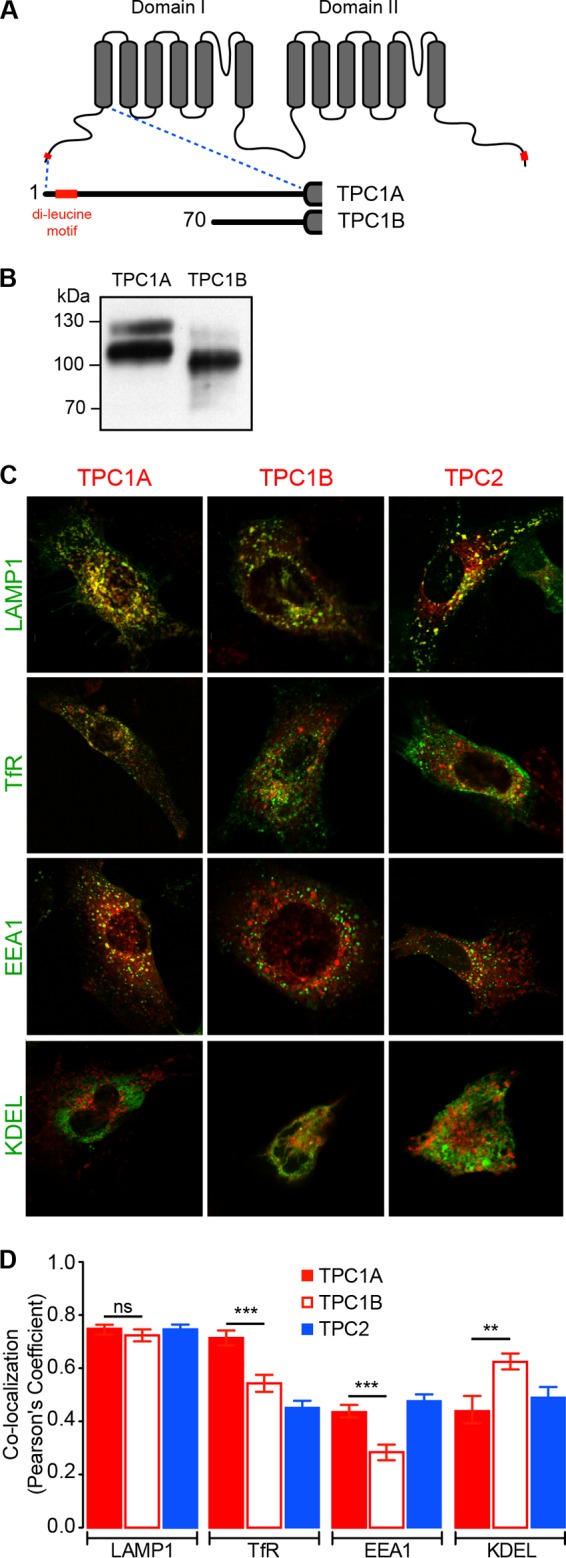
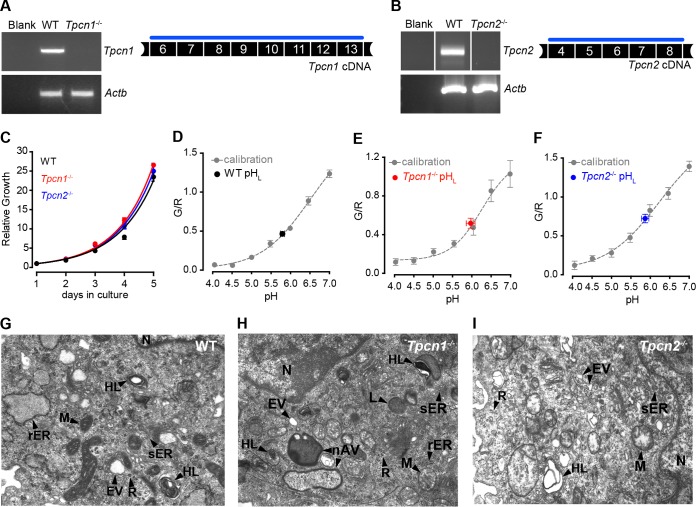
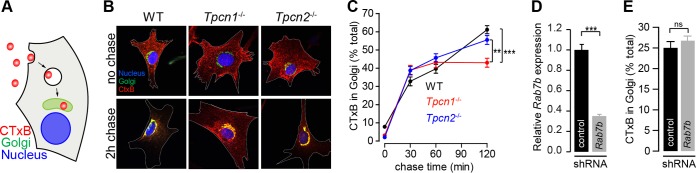
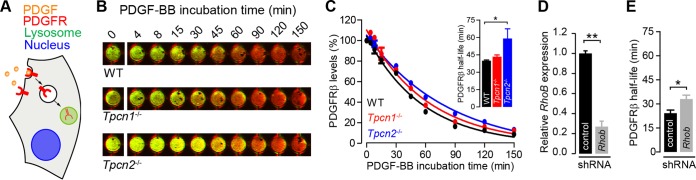
Organelle ion homeostasis within the endo-lysosomal system is critical for physiological functions. Two-pore channels (TPCs) are cation channels that reside in endo-lysosomal organelles, and overexpression results in endo-lysosomal trafficking defects. However, the impact of a lack of TPC expression on endo-lysosomal trafficking is unknown. Here, we characterize Tpcn1 expression in two transgenic mouse lines (Tpcn1(XG716) and Tpcn1(T159)) and show expression of a novel evolutionarily conserved Tpcn1B transcript from an alternative promoter, raising important questions regarding the status of Tpcn1 expression in mice recently described to be Tpcn1 knockouts. We show that the transgenic Tpcn1(T159) line lacks expression of both Tpcn1 isoforms in all tissues analyzed. Using mouse embryonic fibroblasts (MEFs) from Tpcn1(-/-) and Tpcn2(-/-) animals, we show that a lack of Tpcn1 or Tpcn2 expression has no significant impact on resting endo-lysosomal pH or morphology. However, differential effects in endo-lysosomal function were observed upon the loss of Tpcn1 or Tpcn2 expression; thus, while Tpcn1(-/-) MEFs have impaired trafficking of cholera toxin from the plasma membrane to the Golgi apparatus, Tpcn2(-/-) MEFs show slower kinetics of ligand-induced platelet-derived growth factor receptor β (PDGFRβ) degradation, which is dependent on trafficking to lysosomes. Our findings indicate that TPC1 and TPC2 have important but distinct roles in the endo-lysosomal pathway.


Figures

FIG 1
FIG 1
The gene trap mutation in Tpcn1XG716 does not abolish Tpcn1 expression. (A) Schematic representation of Tpcn1XG716 gene structure based on the gene with GenBank accession number NM_145853.2. Red block, gene trap sequences (SA, splice acceptor; LacZNeo, chimeric β-galactosidase and neomycin phosphotransferase II sequences; pA, polyadenylation signal); vertical segments, exons; unfilled sections, UTRs. (B) PCR strategy for determination of the insertion site of gene trap vector pGT1Lxf in the Tpcn1XG716 allele. Several combinations of forward (F) and reverse (R) primers were used to narrow the location of the gene trap vector within the intron. (C) The product from PCR with primers F2/R4 was cloned into pCRIITOPO (Invitrogen) and sequenced, and the insertion site of the gene trap within the intron was determined to be between 2,754 and 2,757 bp upstream of exon 3 (marked in red). (D) Genotyping for WT and Tpcn1XG716 alleles. Numbered white and black blocks, noncoding and coding exons, respectively; blue lines, PCR-amplified regions; Het, heterozygote. (E) RT-PCR analysis of the expression of the chimeric trapped Tpcn1XG716 transcript (Tpcn1A-LacZ-Neo) from WT and homozygote Tpcn1XG716 animal tissues. Blank, a reaction with no RNA. (F) Immunoblotting analysis of chimeric TPC1A–β-galactosidase–neomycin phosphotransferase II protein in tissue homogenates from WT and homozygote Tpcn1XG716 animals using an anti-β-galactosidase (anti-β-gal) antibody. WB, Western blotting. (G) Expression of Tpcn1A/B determined by probing for transcript regions downstream from the gene trap insertion in tissues from WT and homozygote Tpcn1XG716 animals. (H) Copy number of Tpcn1A/B transcripts in liver from WT and homozygote Tpcn1XG716 animals determined by RT-qPCR. Bars correspond to the mean ± SEM for 4 to 8 animals. (I) Expression of the Tpcn1A transcript in the liver resulting from skipping of the gene trap cassette.
FIG 2
FIG 2
Expression of Tpcn1B from an alternative promoter adjacent to exon 3. (A) Schematic representation of genomic organization of Tpcn1A and Tpcn1B transcript isoforms. Vertical lines, exonic sequences; unfilled boxes, UTRs. Transcription of Tpcn1B initiates between exons 2 and 3 at sequences that are intronic relative to Tpcn1A. (B) Genomic profiling of markers associated with transcription initiation sites determined by Paraclu clusters of cap analysis of gene expression (CAGE; red and yellow arrowheads, high- and medium-density clusters, respectively, adapted from the FANTOM3 mouse functional annotation database), regions showing DNase I hypersensitivity (DNase I HS; adapted from the UCSC ENCODE/UW data on the basis of results from a transformed mouse mammary adenocarcinoma cell line, the 3134 cell line), and regions with a high incidence of trimethylated lysine 4 of histone 3 (H3K4me3; adapted from the UCSC ENCODE/PSU data on the basis of chromatin immunoprecipitation-sequencing of megakaryocytes). (C) RT-PCR analysis using a Tpcn1B-specific forward primer of gene expression from the alternative promoter in tissues from WT and homozygote Tpcn1XG716 animals.
FIG 3
FIG 3
A targeted mutation in the Tpcn1T159 gene abolishes Tpcn1 expression. (A) Schematic representation of Tpcn1T159 gene structure based on the gene with ID no. 252972 and the cDNA sequence with GenBank accession number NM_145853.2. Red blocks, knockout cassette (SA, splice acceptor; IRES, internal ribosomal entry site; pA, polyadenylation signal). The neomycin resistance gene (Neo) is under the control of a promoter present downstream of the LacZ gene. Vertical segments, exons; unfilled boxes, UTRs. (B) Genotyping of mice for WT and Tpcn1T159 alleles. Numbered black blocks, coding exons; blue lines, PCR-amplified regions. (C, D) RT-PCR results for expression of Tpcn1 transcripts in tissues from WT or Tpcn1T159 homozygote mice. Blank, reactions with no RNA; numbered white boxes, noncoding exons. (C) Expression of the truncated chimeric Tpcn1A-LacZ transcript from the Tpcn1T159 allele. (D) Expression of the Tpcn1A/B transcript determined by probing for regions downstream from the gene targeted disruption. (E) Copy number of Tpcn1A/B transcripts detected in liver from WT and homozygote Tpcn1T159 animals using RT-qPCR. Bars correspond to the mean ± SEM for 4 animals. (F) Immunoblotting analysis of TPC1A/B present in membrane samples from tissues of WT or Tpcn1T159 homozygote mice using an anti-TPC1 antibody recognizing the C-terminal region of TPC1 proteins. Red markings, immunoreactive bands not present in Tpcn1T159 samples.
FIG 4
FIG 4
Colocalization of mouse TPC1A, TPC1B, and TPC2 with distinct endo-lysosomal organelle markers. (A) Schematic representation of the transmembrane segments (gray boxes) of TPC1 and the N-terminal truncated TPC1B isoform predicted to be produced from the Tpcn1B transcript. Red, the dileucine motif(s) present in TPC1A and TPC1B. The numbers correspond to the starting amino acid residue. (B) Immunoblotting analyses of expression of mCherry-tagged TPC1A and TPC1B using an antimultired antibody. (C, D) Representative images of immortalized MEFs coexpressing GFP-tagged organelle markers (Lamp1 for late endosomes/lysosomes, TfR for recycling endosomes, EEA1 for early endosomes, and KDEL for ER) and mCherry-tagged TPC1A, TPC1B, and TPC2. (D) Compilation of colocalization coefficient between organelle markers and TPC proteins. Results are represented as the mean ± SEM for 10 to 32 cells. ns, no significant difference (P > 0.05); **, P < 0.01; ***, P < 0.001.
FIG 5
FIG 5
Growth properties, endo-lysosomal pH, and morphology of MEFs from Tpcn1−/− and Tpcn2−/− embryos. (A, B) RT-PCR analysis of Tpcn1 (A) and Tpcn2 (B) expression in MEFs derived from WT or Tpcn1−/− and Tpcn2−/− embryos. Amplified cDNA regions correspond to the numbered exonic sequences covered by the blue line. Expression of Actb was used as a control. (C) Growth curves of primary MEFs in culture. (D to F) Determination of endo-lysosomal luminal pH (pHL) in MEFs from WT (D), Tpcn1−/− (E), and Tpcn2−/− (F) embryos. Values were determined against a calibration curve of the ratios of fluorescein/Texas Red fluorescence (G/R) against a series of defined pH values in fluorescent dextran-loaded MEFs of each genotype. (G to I) Organellar morphology assessed by electron microscopy of MEFs from WT (G), Tpcn1−/− (H), and Tpcn2−/− (I) embryos. Primary MEFs (passage numbers, <5) were used in all experiments. nAV, nascent autophagic vesicle; rER, rough endoplasmic reticulum, sometimes showing a dilated appearance; sER, smooth endoplasmic reticulum, sometimes showing a granular appearance; EV, endocytic vesicles; HL, heterogeneous lysosomes, including multilamellar bodies and multivesicular structures; L, lysosomes; M, mitochondria; N, nucleus; R, free ribosomes.
FIG 6
FIG 6
Impact of knockout expression of Tpcn1A/B or Tpcn2 in cholera toxin trafficking. (A) Schematic representation of CTxB trafficking from the plasma membrane to the Golgi apparatus. (B) Representative images for 0-min (no chase) and 120-min chase periods at 37°C, after 30 min incubation on ice with Alexa Fluor 555-labeled CTxB. Cells were immunolabeled with an antibody against the Golgi apparatus marker protein GM130. Cell boundaries are identified with a white broken line. (C) Quantification of CTxB levels in the Golgi apparatus at the indicated chase time after the CTxB binding period (n = 56 to 93). (D, E) Effects of treatment of WT MEFs with shRNA (shRNA targeting Rab7b or a scrambled sequence control) on relative Rab7b mRNA levels determined by RT-qPCR (D) and on CTxB levels in the Golgi apparatus after a chase period of 120 min (E) (n = 32 to 36). Data points correspond to the mean ± SEM. ns, no significant difference (P > 0.05); **, P < 0.01; ***, P < 0.001. Primary MEFs (passage numbers, <5) were used in all experiments.
FIG 7
FIG 7
Impact of knockout expression of Tpcn1A/B or Tpcn2 in PDGFRβ degradation. (A) Schematic representation of PDGFR internalization from the plasma membrane to the lysosomes and degradation induced by the ligand PDGF. (B) Representative images of MEFs treated with 20 ng/ml PDGF-BB (in the presence of 20 μg/ml cycloheximide) for the indicated times at 37°C. Green and red signals, PDGFRβ and CellTag 700 staining, respectively; yellow, high levels of PDGFRβ. (C) The levels of PDGFRβ detected with an anti-PDGFRβ antibody were normalized to the number of cells detected with CellTag 700 stain. Data points were fitted to an exponential decay curve, and half-lives were determined for each genotype (in the graph, n = 3). (D, E) Effects of treatment of WT MEFs with shRNA (shRNA targeting Rhob or a scrambled sequence control) on relative Rhob mRNA levels determined by RT-qPCR (D) and on the half-life of PDGFRβ in PDGF-BB-treated cells (E) (n = 3). Data points correspond to the mean ± SEM. *, P < 0.05; **, P < 0.01. Primary MEFs (passage numbers, <5) were used in all experiments.

Comment in

  • TPC1 Knockout Knocks Out TPC1.
    Hooper R, Churamani D, Davidson SM, Lin-Moshier Y, Walseth TF, Patel S, Marchant JS. Hooper R, et al. Mol Cell Biol. 2015 May;35(10):1882-3. doi: 10.1128/MCB.00020-15. Mol Cell Biol. 2015. PMID: 25900974 Free PMC article. No abstract available.
  • Reply to "TPC1 Knockout Knocks Out TPC1".
    Ruas M, Galione A, Parrington J. Ruas M, et al. Mol Cell Biol. 2015 May;35(10):1884. doi: 10.1128/MCB.00083-15. Mol Cell Biol. 2015. PMID: 25900975 Free PMC article. No abstract available.

Similar articles

Cited by

References

    1. Zwang Y, Yarden Y. 2009. Systems biology of growth factor-induced receptor endocytosis. Traffic 10:349–363. 10.1111/j.1600-0854.2008.00870.x. - DOI - PubMed
    1. Blakely RD, Edwards RH. 2012. Vesicular and plasma membrane transporters for neurotransmitters. Cold Spring Harb. Perspect. Biol. 4:a005595. 10.1101/cshperspect.a005595. - DOI - PMC - PubMed
    1. Bird PI, Trapani JA, Villadangos JA. 2009. Endolysosomal proteases and their inhibitors in immunity. Nat. Rev. Immunol. 9:871–882. 10.1038/nri2671. - DOI - PubMed
    1. Kraft C, Martens S. 2012. Mechanisms and regulation of autophagosome formation. Curr. Opin. Cell Biol. 24:496–501. 10.1016/j.ceb.2012.05.001. - DOI - PubMed
    1. Groves E, Dart AE, Covarelli V, Caron E. 2008. Molecular mechanisms of phagocytic uptake in mammalian cells. Cell. Mol. Life Sci. 65:1957–1976. 10.1007/s00018-008-7578-4. - DOI - PMC - PubMed

Publication types

LinkOut - more resources